March Madness is surely the most exhilarating playoff system in American sports. We love the tournament—but it also isn't perfect. Which got us to thinking: Is there a better way to organize March Madness?
As it stands, the NCAA tournament has two main issues, if you can call them that. First, it renders the regular season almost meaningless. Last year, even the highest rated regular season game was still well below the average tourney game, and for most intents, the results don't amount to much more than a trip to the tournament and a higher seed if you do well. This leads to the second thing: As Nate Silver observed back in 2011, the bracket produces misaligned incentives. In other words, earning a higher seed doesn't always give you a better chance of success in the tournament. A team of average rating (about a 7 seed) has a much higher probability of advancing to the later rounds from the No 10-15 seed slots than from the No. 8-9 slots, which in theory would incentivize mid-tier teams to tank for a lower seed. In reality, this "tanking" would basically only apply to juggernaut teams in small conferences, but it's still not ideal.
So, why not see what else is out there? Here's a look at how three different tournament formats would affect the value of each seed, as well as how they'd affect this year's tournament field.
How to read these:
Each tournament format has an illustration of what one region of the bracket would look like. Below that, there are two charts.
For the chart on the left, we'll use a slightly altered version of a metric Silver introduced, expected Tournament Success Points (TSPs), awarding 1, 2, 4, and 8 points for advancing to the Round of 32, Sweet 16, Elite 8, and Final 4 respectively. We use weighted aggregate ratings from Jeff Sagarin and Ken Pomeroy from 2003-2014, which can produce an average power rating for each seed that can be converted into a spread for any matchup. These will serve as a generic model that can be applied to any season. In these graphs, we will use Silver's concept of substituting in an average team (about a 7 seed) into each slot, while keeping all other seed ratings constant—a method that produces the value of each seed position in the bracket. Think of the left chart as the degree of difficulty for the seeds. A taller bar means an easier path.
The chart on the right follows three teams in this year's tournament, using data gathered by Ed for The Power Rank, and tracks how much more or less likely they are to make the round of 32, Sweet 16, Elite 8, and Final Four. We're following Kansas, Ohio State, and Albany, the 2-, 6-, and 16-seeds in the South regional, respectively. Think of the chart on the right as the teams' chances of advancing in an alternate universe, where these formats are being played this year.
1. Current Format
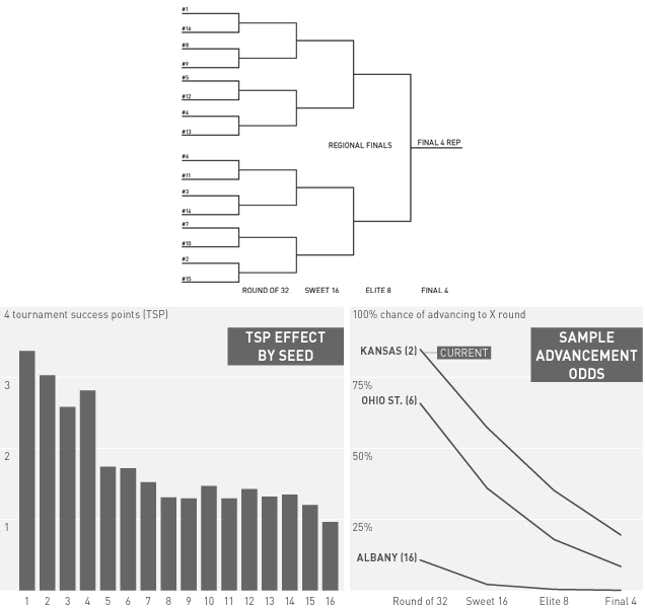
How It Works: This is the tournament as you know it. It's a 68-team field, with four regions, and four play-in games.
Pros: We already have it! It's a tradition!
Cons: As laid out above, there are issues with the expected TSP by seed. As you can see, there's a bit of a hump from seeds No. 10-15, which produces misaligned incentives. There's also a pretty substantial backward shift from No. 3 to No. 4 seed.
2. World Cup-Style Groups
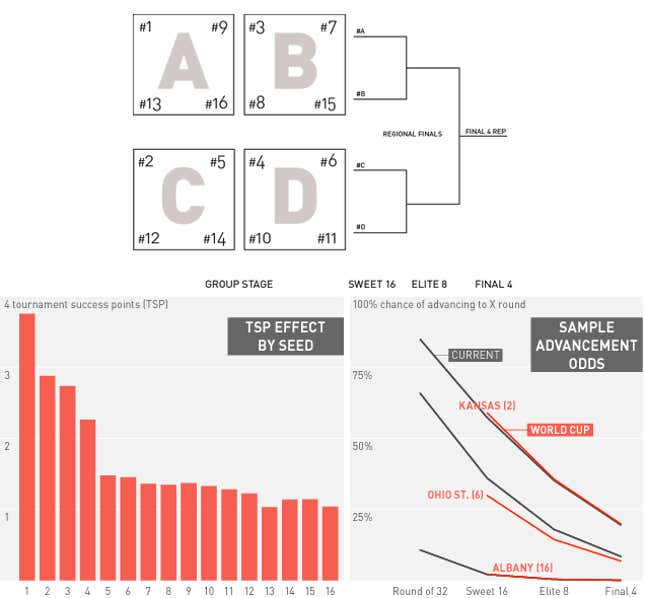
How It Works: Each region's 16 teams are split into four groups, arranged into a customized distribution in the seeding pods for more equitable distribution of teams. This is putting our thumb on the scale a bit, and differs from the true World Cup style, which only seeds 1-8 and randomizes the rest of the groups. Every group plays a round robin (six games total; each team plays three times), and the top two teams in the group advance to a round-of-32 single elimination bracket. For the purposes of this exercise, tiebreakers are head-to-head followed by higher seed. In reality, you would likely want to use scoring margin, or something more tied to performance. (Or, hey, what about team GPA!)
The groups, by seed:
- A: 1-9-13-16
- B: 3-7-8-15
- C: 2-5-12-14
- D: 4-6-10-11
Each group winner feeds into a four-team bracket of A vs. B and C vs. D
Pros: Well, it's different. This model has a nice steadily decreasing slope over the first four seeds but then pretty much flattens out the rest of the way. (Note: For this model, I counted winning one's pool as four points to keep the total TSPs per model consistent.)
Lower seeds have a much lower chance of "advancing" (though, surprisingly, this season's data from The Power Rank shows low seeds' chances of winning the group are about equivalent to their odds of reaching the Sweet 16 in the current format), but they are guaranteed to play three tournament games instead of just the one where they will likely be crushed.
Finally, this model produces more games—48 more to be exact—which the NCAA and its $10.8 billion TV deal will surely appreciate. Realistically, this probably would blow the tournament into an additional weekend, which no one's going to complain about.
Cons: A lot, actually. For one, basketball is less suited to group play than soccer is. So, the tiebreak is going to be a huge headache here. As we have it set up, the low seeds practically have to sweep the group to advance. But if it were moved to margin of victory, it would incentivize some very ugly running-up-the-score business by top seeds, to ensure they move on.
You'd be able to avoid some of the no-low-seeds-advance loss of fun if you allowed two teams to advance from the group, into a round of 32—though this would disrupt the two-weekends schedule of the opening rounds. Alternative seeding would also accomplish this, by seeding 1-8-9-16, 2-7-10-15, etc., which is far less efficient for maintaining fair strength, but retains traditional 8-9-type pairings. Or you could simple go the World Cup route and group 1-8, 2-7, 3-6, etc., and randomize the rest. However, any of these options would allow a decent possibility of top seeds facing each other in the Round of 32 should one of them not finish first in their pool.
This Year: Wichita State gets the biggest boost of any team in this format, as they now avoid the best team in their bracket, No. 4 Louisville, until the Elite 8 as well as avoiding a dangerous No. 8 Kentucky team until the Sweet 16.
No. 2 Villanova is the only seed among the top four in each region to see a drop in TSPs in this format. Due to a tougher group compared to its first weekend opponents, Nova has a much smaller chance of winning their pool (52.1%) than they do of advancing to the Sweet 16 (66.6%) in the current bracket.
3. Tiered Bye Bracket
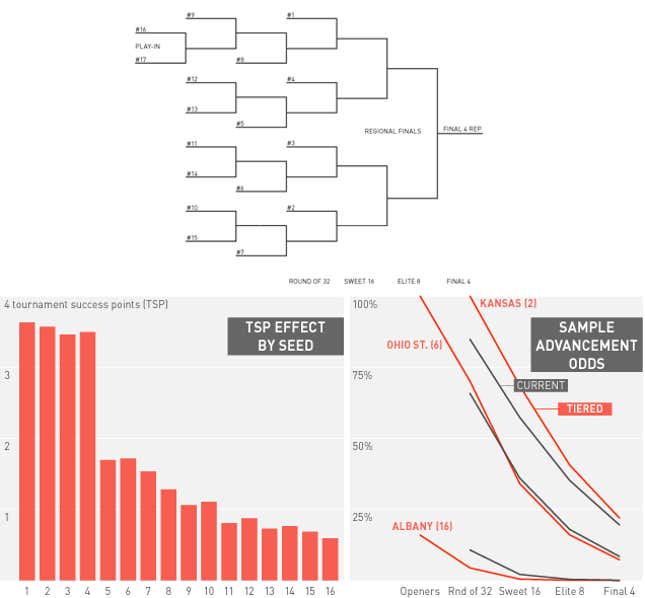
How It Works: The seeding arrangement largely stays the same, but seeds No. 1-4 get a bye to the round of 32, while seeds No. 9-15 have to play an extra game to get to the round of 64. (The play-in seeds have to play two extras.)
Pros: This is the only model that produces a noticeable downward TSP slope over the bottom eight seeds. So essentially, this is the "fairest" bracket to the back end of the pool. But that doesn't mean they're out in the cold! As you see with the play-in round, small schools would likely welcome the opportunity to pick up a few wins (and $1.5 million win shares) against teams other than the very top seeds.
There's a massive drop-off after snagging a top-four seed, which could make for an interesting "bubble-within-the-bubble watch" each season. This could be good or bad, but would at least be interesting for "safe" teams at the top.
Cons: You lose the total anarchy of first 48 hours of the tournament, and the wider excitement that anyone could go down over the first weekend. Small schools that manage to work their way into a high seed would also be punished by not getting those wins, and cash. And on a higher concept level, the idea of multiple byes for top seeds undercuts the tournament's egalitarian ethic.
This Year: In the real brackets, all the No. 4 seeds get a big boost in TSP, as they all automatically advance to the round of 32. Iowa St. gets an especially big boost for a No. 3 seed, as it now avoids a dangerous first round matchup with No. 14 North Carolina Central.
The No. 11 and 12 seeds take the biggest hits to their TSPs in this format. No. 9 Pittsburgh also takes a sizable hit of 0.632 TSPs, as they only have a 79.8% chance of getting past No. 16 Albany. And poor No. 16 Weber State sees its already-miniscule TSP drop 73.0%.
4. Randomized 7-16 seed placement
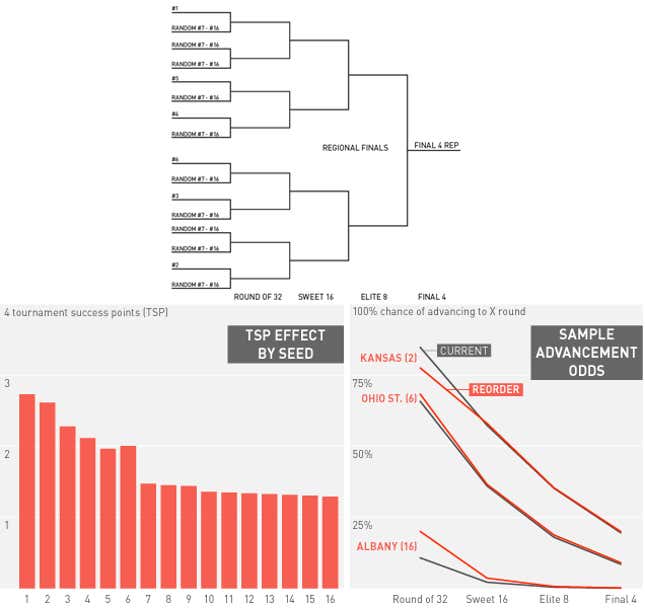
How it Works: Hey, why totally throw out what isn't totally broken to begin with! This is a model Silver suggested a few years back. Seeds 1-6 stay locked in their normal position in the bracket while seeds 7-16 are randomly distributed everywhere else.
Pros: There's only one seed (6) that is more valuable than the one ahead of it. That's pretty good! The bottom half of this chart is nearly flat, as securing a randomly placed seed doesn't really get you much of an advantage compared to the other randomly placed seeds. In this version, the bottom seeds get a big boost, as they're no longer assured of facing a high seed in the first round.
Cons: Not many! A few high seeds, like Michigan this year (explained below) will get a raw deal, but at least that unfairness isn't baked into the seeds themselves.
This Year: No. 16 Weber State gets the biggest relative benefit in avoiding a matchup with No. 1 Arizona, increasing its TSPs by 113.4%. No. 9 Oklahoma State sees the biggest total increase in TSPs, gaining an extra 0.447, as they face a much easier route to the later rounds when they too can avoid the Wildcats in the first weekend.
No. 2 Michigan takes by far the biggest relative and total hit in this version, as they now avoid a relatively cushy first weekend against the weak No. 15 Wofford, No. 7 Texas, and No. 10 Arizona State.
So are any of these actually better?
While there are obviously other tournament models that plug the holes in March Madness, these three are practical that they a) employ the standard 68 teams, four regions, and two weekends of play before the Final Four, b) retain the tourney's hallmark of single elimination magic for at least the later rounds, and c) employ a rigid configuration so that brackets can still be filled out by fans (i.e. no re-seeding after each round or multiple teams advancing from pool play). But let's see how they actually improved anything.
Objective 1: Properly align incentives for attaining each slot
To judge each of these formats in their success in this area, I'll sum each of the reverse-oriented TSPs changes between consecutive seeds (e.g. If the No. 6 seed slot produces 0.3 more expected TSPs than the No. 5, then this will be counted as -0.3).
| Format | Total misaligned TSPs |
| Current | -0.569 |
| Tiered Bye Bracket | -0.211 |
| World Cup | -0.134 |
| Randomized 7-16 Seeds | -0.039 |
By this measure, the randomized bracket is clearly superior, with all but one seed having a proper decline in expected TSPs from the seed ahead of it.
Objective 2: Increase meaning of regular season
Here, we'll judge the success of this objective by looking for graphs that have a steady downward trajectory in expected TSP from No. 1 to No. 16, which give noticeable incentives for each seed throughout the bracket ladder. To do this, we'll use a measure we're referring to as "Slope Index," which is calculated by adding 0.5 to each change in expected TSP from seed to seed and multiplying these numbers together when each model is split into fifths: (1st-4th) x (3rd-7th) x (7th-10th) x (10th-13th) x (13th-16th) and into thirds: (1st-6th) x (6th-11th) x (11th-16th). The sum of these two figures constitutes the Slope Index.
This metric rewards models that have a large steady downward slope rather than ones with choppy jumps or flat stretches.
| Format | Slope Index | Percentage change from current bracket |
| Current | 2.230 | N/A |
| Tiered Bye Bracket | 3.228 | 44.8% |
| World Cup | 1.980 | -11.2% |
| Randomized 7-16 Seeds | 1.009 | -54.8% |
By this measure, the tiered bye bracket is head and shoulders above the rest, as it is the only model that sees an increase in Slope Index from the current format—and by a pretty substantial margin at that.
Final Thoughts
Comparing these two metrics, there doesn't appear to be a clear winner. On one hand, the tiered bye bracket produces the most meaningful regular season, but there are a number of misaligned incentives in that might encourage some minor tanking. On the other hand, the randomized 7-16 seed bracket produces nearly perfectly aligned incentives, but the low Slope Index makes the regular season even more worthless than it is currently.
All of the models seem to be—in at least some way—an improvement on the current format. They're compelling enough to consider what it might be like talking about March Madness "groups of death."
Bracket images by Sam Woolley
Charts by Reuben-Fischer Baum
Jim Pagels is a writer who blogs about sports innovations at lowerthemound.wordpress.com. You can follow him on Twitter at @jimpagels.
Ed Feng runs The Power Rank, where he 's developed his own algorithms for ranking sports teams; he also holds a Ph.D. in chemical engineering from Stanford. You can follow him at @thepowerrank.