Ned Yost has led the Royals to their best two-season stretch in a quarter century and put the 19th highest paid major league team in the World Series. But rather than garnering manager-of-the-year consideration, Yost gets shat on. Why is that?
Yost doesn't help himself with strange postgame comments and non-existent media awareness. Calling out fans for their shitty-ass attendance isn't doing him favors either. Regardless, it's still incredible a manager leading a low-payroll team this deep is so polarizing.
Unlike players, it's very difficult to isolate manager's contributions. And while there are limitations to measuring managers solely off team statistics, it's still the most common way they're judged. So let's look at how the Brewers and Royals fared with and without Yost. And if he really did bring more small ball to those organizations.
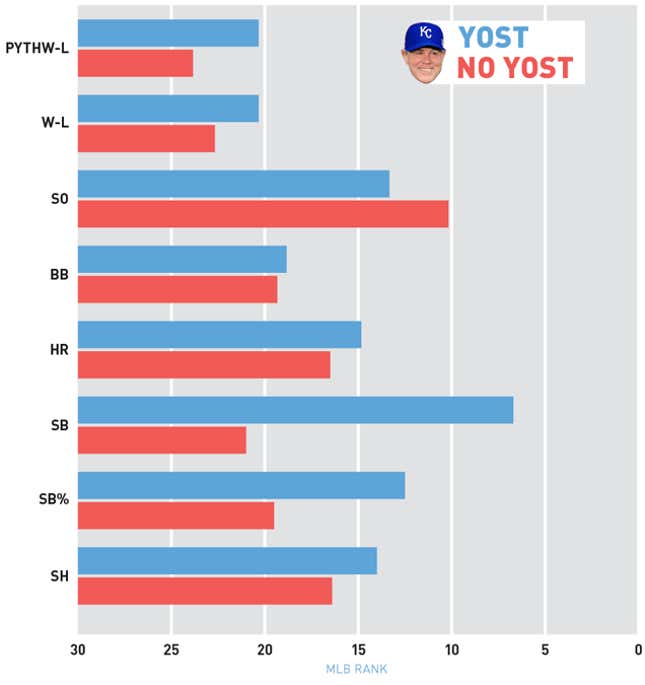
The chart below compares the Brewers and Royals average MLB rank in a few small-ball indicators and in winning percentage under Yost and under managers he replaced or was replaced by. "Yost" bars consist of an average of the two-year intervals immediately after Yost was hired or before he was fired. The "No Yost" bars consist of two-year intervals preceding the hiring of or following firing of Yost. Using these short durations allows us to compare how teams with similar rosters fared with and without Yost. The table below the chart lists year-by-year MLB ranks for each category using data from Baseball Reference.
| No Yost Team | Year | SH | SB | SB% | HR | BB | SO | W-L | PythWL |
| Brewers | 2001 | 9 | 26 | 25 | 6 | 22 | 1 | 23 | 22 |
| Brewers | 2002 | 4 | 13 | 23 | 27 | 22 | 6 | 28 | 28 |
| Brewers | 2009 | 14 | 28 | 28 | 10 | 6 | 4 | 17 | 19 |
| Brewers | 2010 | 26 | 21 | 8 | 5 | 9 | 8 | 21 | 21 |
| Royals | 2008 | 22 | 21 | 26 | 27 | 30 | 24 | 20 | 24 |
| Royals | 2009 | 23 | 17 | 7 | 24 | 27 | 18 | 27 | 29 |
| n/a | Average | 16.3 | 21.0 | 19.5 | 16.5 | 19.3 | 10.2 | 22.7 | 23.8 |
| Yost Team | Year | SH | SB | SB% | HR | BB | SO | W-L | PythWL |
| Brewers | 2003 | 11 | 7 | 11 | 7 | 11 | 2 | 26 | 27 |
| Brewers | 2004 | 16 | 2 | 3 | 29 | 13 | 2 | 26 | 26 |
| Brewers | 2007 | 11 | 15 | 14 | 1 | 24 | 10 | 14 | 13 |
| Brewers | 2008 | 15 | 11 | 12 | 5 | 15 | 9 | 6 | 10 |
| Royals | 2010 | 16 | 8 | 20 | 26 | 24 | 30 | 26 | 27 |
| Royals | 2011 | 15 | 3 | 15 | 21 | 26 | 27 | 24 | 19 |
| n/a | Average | 14.0 | 7.7 | 12.5 | 14.8 | 18.8 | 13.3 | 20.3 | 20.3 |
Winning percentage was slightly higher under Yost and on average it lined up with pythagorean expectations. And under Yost the Brewers and Royals ranked slightly higher in sac bunts (SH) and significantly higher in stolen bases (SB), which are decisions managers have control over.
And not only do Yost teams steal more bases, but they're effective when they do so. On average, teams under Yost ranked 12.5 in stolen base percentage while non-Yost teams ranked 19.5. Effective base stealing was again evident this season as the Royals ranked third in stolen base percentage while stealing 10.9 percent more bases than any other team in baseball (Royals led with 153, Dodgers were second with 138). Their steals were worth 8.8 runs this season and their aggressiveness in taking extra bases on hits was worth 5.2 runs.
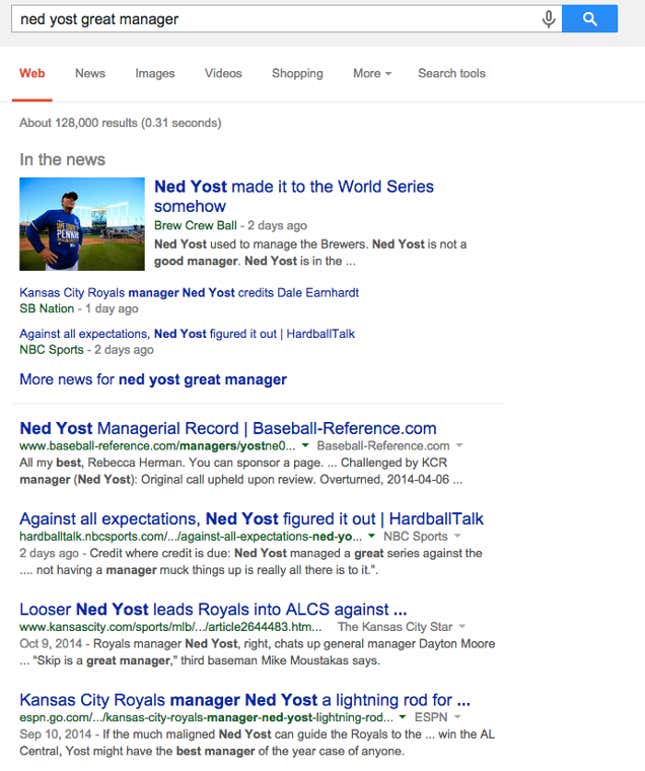
These numbers make Yost look like a decent manager. But if you Google incognito "Ned Yost great manager," most of the top pages are still unfavorable toward him. Do the same thing for Buck Showalter and you'll damn near find canonization applications.
It's not like Yost is baseball's Gregg Popovich, but he's also not the disaster he's sometimes made out to be. It's important to keep context in mind when evaluating how often he "costs" his teams games.
The Royals have been playing in a low-run environment, where one-run strategies are worthwhile. Which is largely due to strategic choices as Kauffman Stadium is actually mildly hitter-friendly as its park factors favor batters four to five percent. Sure, Yost went a bit overboard bunting in the wild-card game. But several of those bunts were defensible. They look ridiculous in hindsight, but prior to their outcome and working with the information Yost had at hand, they make sense. Well, somewhat.
It shouldn't be shocking Yost would rely so heavily on bunting. During the season, the Royals led MLB in sac bunt Win Probability, adding an entire win. Yost found a small advantage that on average works in his favor, which is how he's won games with a lineup low on power. The Royals led the majors with 153 stolen bases this year, but finished last in home runs with just 95. Royals hitters also had the fewest strikeouts in baseball, striking out only 6.08 times per game, and were reliable putting the ball in play.
With his team's speed and defensive prowess, it makes sense Yost plays small ball. But playing in a low-run environment produces a lot of close games, which subtly gives critics potential ammo. It's easier to chalk a close win up to clutch hitting or pitching, and close losses to a manager putting his players in a position to fail. Managers with power-hitting teams that rely on home runs and less decisions from the bench don't deal with this as much. And because humans tend to perceive the world through a negativity bias any time a Yost-called bunt or steal doesn't work now, there's surely people thinking well there he goes again.
Yost might dick himself here and there, but his calls have tended to pay off in the context in which he's working. The Royals are not in the World Series in spite of him. If the 11th rated team in run differential catches a few more breaks and ends up taking the crown, crazy ol' Ned Yost will have been a big reason why.
Chart by Sam Woolley
Photo: Jamie Squire / Getty Images Sport