Around this time every year, a handful of major college football programs dump their coach in search of quick success. Some moves work better than others.
Guys like Gus Malzahn, who in his first season took a 3-9 team from the year before to the national title game, make their athletic directors look brilliant. On the other hand, firing Ralph Friedgen who won 60 percent of his games at Maryland, looks awful when the replacement's record is about 20 percentage points worse than Friedgen's after four years. But to really judge success, you've got to put it alongside expectations. #BOlievers proclaim Bo Pelini won at least nine games in his seven seasons at Nebraska, which might sound amazing to Iowa State fans, but for a school that's only missed two bowl games since 1969, that didn't quite meet high expectations so Pelini was fired.
To control for the success of programs, we compared how fired coaches' teams performed to how their schools performed ten years prior to their arrival. We used SRS ratings from Sports Reference, which measures teams' expected point differential against an average opponent. While SRS is more of a predictive than retrodictive metric, standard measures to explain past performance like BCS ratings or the Massey Composite only stretch back to the late 1990s. And polls like the AP or coaches' only measure a fraction of all teams. SRS gives us a bit more historical scope while still indexing the strength of all college football teams.
We used CollegeFootballPoll.com to get a list of fired coaches from Power Five conferences. Only coaches that were fired or forced to resign or retire for on-field reasons from 2005-2014 were included. Most cases were obvious, but due to athletic departments tiptoeing around honest transparency to prop up an image, there were some judgement calls. Phillip Fulmer stepped down as Tennessee's head coach, but seemed pretty goddamn angry about having to do so. Lloyd Carr's retirement feels like a force out, but his behavior doesn't indicate that he wasn't on-board with the decision. After coaching the Wolverines, Carr became an associate athletic director at the school and still pumps up the program to media and gives takes on who he'd like to see coach at Michigan. Fulmer is on this list, Carr is not. And coaches like Dennis Franchione and Gary Barnett had teams with declining success but also had off-field issues, where the cause of their release has a bit of chicken-and-egg. In these instances, coaches weren't put on the list since it wasn't entirely clear the on-field struggles got them canned.
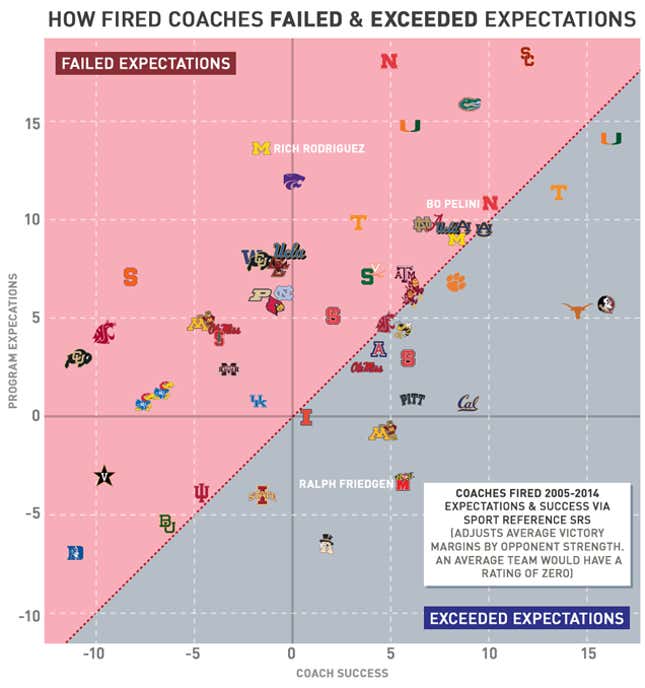
The clickable and sortable table below corresponds with the above chart. "Team" represents the horizontal axis and shows how good teams were under their coaches on average. "Expect" represents the vertical axis and shows how good those programs were on average in the ten years before the coach was hired. "Diff" is the difference between a coach's performance and that school's previous ten years. "Diff" is measured in the graph by how far team logos are from the dotted diagonal. Those above the dotted line "failed" program expectations while those below the line "exceeded" expectations.
Greg Robinson of Syracuse and Rich Rod at Michigan most "failed" their schools expectations. Rich Rod failed to meet lofty standards with a 40.5 percent winning percentage at a school that hadn't seen a losing season for 40 years prior to his hiring. Robinson was just much shittier than Syracuse's typical run of mediocrity. While Bobby Bowden and Mack Brown most "exceeded" expectations that preceded them by garnering national titles at prestigious programs, the majority of the rest of the top ten came are coaches like Ralph Friedgen who did pretty solid jobs at crappier football schools.
Three coaches fired this year—Pelini, Will Muschamp, Brady Hoke—were in the top ten for team strength, although Hoke and Muschamp had short tenures that got huge boosts from the one season they each made a BCS bowl with rosters full of another coach's recruits. Duke's Ted Roof and Colorado's Jon Embree had the worst teams, but that says as much about their respective programs as it does about their ability to coach. Before hiring Roof, Duke had the lowest "expectations" on this list, with teams that were a touchdown worse than the average team the ten years before Roof was hired. Which is impressive when you consider the percentage of college football teams that come from the MAC, C-USA, and Sun Belt. Lane Kiffin (USC), Bill Callahan (Nebraska), and Muschamp (Florida) dealt with the highest "expectations." But take that with a grain of salt because this doesn't account for NCAA sanctions, which prevented teams like Alabama from achieving greater past success. Coaches in positions similar to Mike Shula faced greater expectations than what's captured here.
Another way coaches are judged is by how good their teams were compared to their predecessors and replacements. And by how good the program has been since they left. In the sortable table below "Prev" is the difference between a coach and his predecessor. "Replace" is the difference between a coach and his replacement. And since a few bad seasons, as oppose to a decade's worth of work, are what gets coaches fired today, we compared the last two seasons under a coach to how those schools have been since they left, which is measured by "2yr." This variable examines how firing coaches has paid off for each program so far.
It's important to keep context in mind when evaluating coaches on this table. Because it shows things like Hoke finishing third in outperforming the guy before him. However, many of Hoke's best players were recruited by Rich Rod, and his best season was that first year when his roster was nearly all Rodriguez players. After that, Hoke took one hell of a nosedive. Rodriguez ranks last in comparing to predecessors. But he implemented an offense drastically different than anything Michigan ran before, and was only given three years at the school despite showing improvement each season. He also followed a successful coach.
In comparing the success of coaches right before they were fired to how programs fared ever since (using "2yr" from the above table), two-thirds (36) of these schools improved, while a third (18 schools) got worse. And programs saw a 3.5 point average improvement and 2.5 point median improvement in SRS compared to their fired coaches' last two seasons.
But part of this is self-selection. Bad coaches tend to get fired, and good coaches tend to not. And when your coach is really, really, bad, like Charlie Weiss, of course firing them will bring improvement. But firing a good but not great coach, like Tommy Tuberville, can become a guessing game where reliable respectability is pitted against the uncertainty of potential greatness. Firing a coach might tend to payoff by making your team a field-goal better against an average opponent. But given a third of firings result in regressions, it's a pretty ballsy move if your coach doesn't really suck.
Chart by Sam Woolley
Previously: Chart: Which NCAA Football Teams Outplay Their Recruit Rankings?