The NFL season is just about half over, which means most teams are what they're going to be. But what does that look like, exactly? Here's a quick visual guide for every NFL team's offense.
How These Work
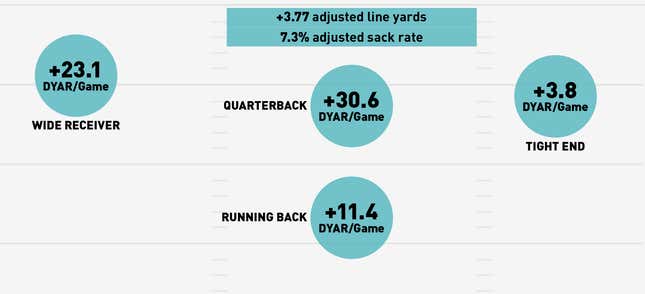
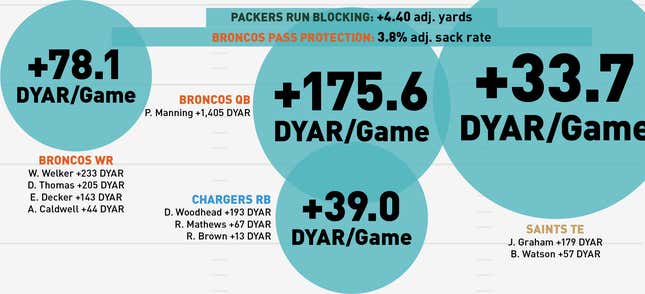
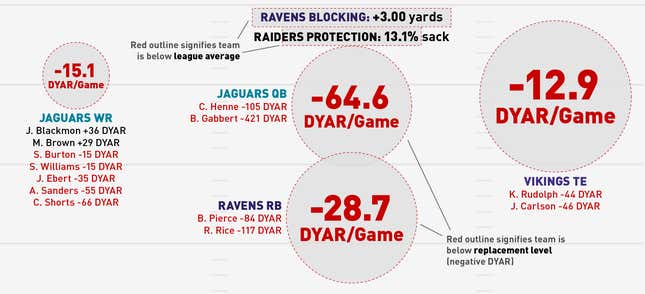
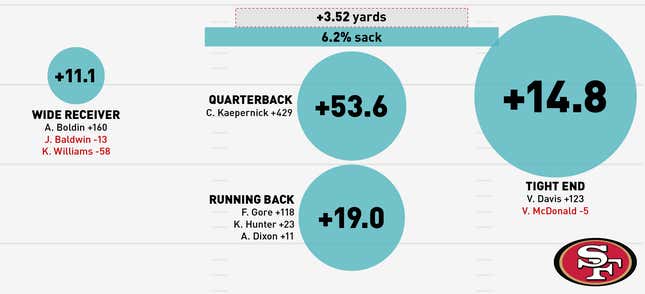
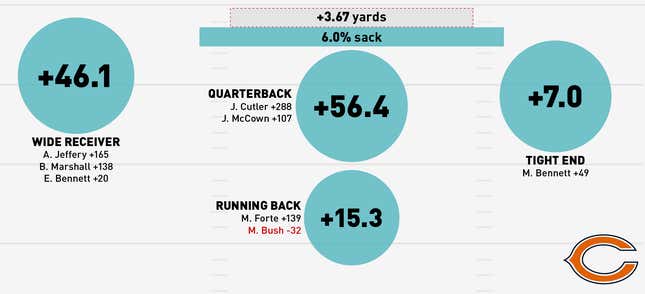
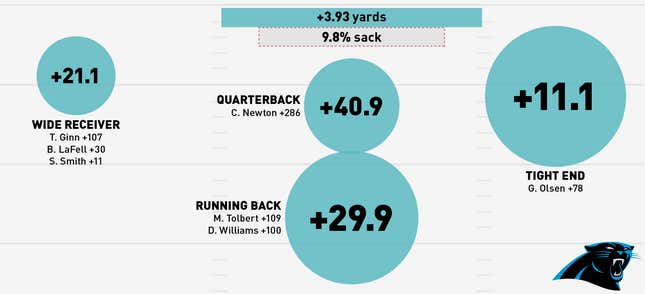
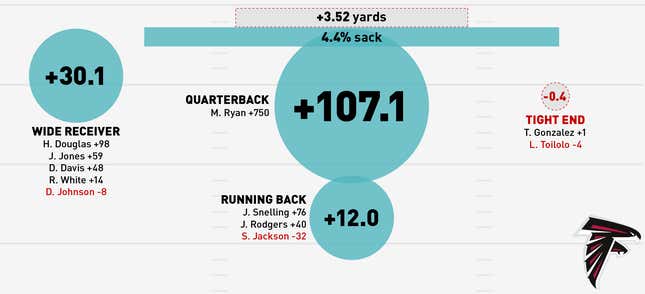
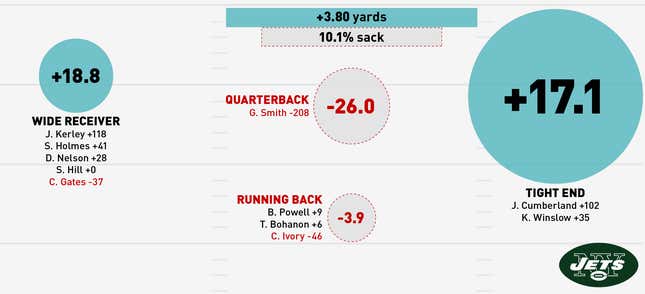
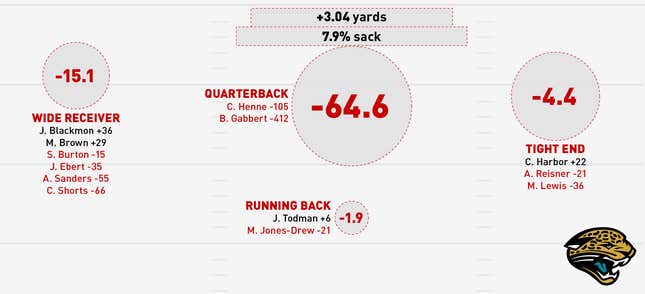
As usual, we're using Football Outsiders data to put these visualizations together. Each circle in these charts represents how productive that position has been for a given team. We added up every qualifying player's DYAR (explained below) at a given position—so you're not just looking at single players, but whole units. (Jordy Nelson has been the single best receiver and Calvin Johnson is a close second, for example, but the Denver group is a better unit.) Bigger circles mean more production. Red circles mean below replacement level play. So, a big red circle means that that position really sucks.
We've changed things up a little bit since the last time we did this. Scaling is a little reined in, so huge performers aren't going to fly off the page as readily (the New Orleans tight ends are still out freakish enough to get out there). Offensive lines are now broken into Football Outsiders's Adjusted Line Yards and Adjusted Sack Rate, which are rushing and pass blocking statistics. Adjusted line yards separates out "open field" yardage to determine how much the line affects running plays; Adjusted Sack Rate comprises sacks intentional grounding penalties, and is adjusted for down, distance, and opponent.
We switched to per game DYAR values for the positions for two reasons: first, we were dealing with far more bye weeks than we did last time. But more importantly, we think it makes it a little more clear about how, exactly, each position is affecting each game. Peyton Manning is worth 175.6 extra DYAR (which converts touchdowns, turnovers, and first downs into yardage values) every single game, and that is an absurd, absurd number. For the individual players listed on the charts, however, we used the full season's DYAR. Not every player plays every game, and those numbers reflect a player's cumulative contribution, but the per-game positional data is what's shown up on the field.
If you're unfamiliar, DYAR stands for Defense-Adjusted Yards Above Replacement. It's a Football Outsiders metric that compiles the total value a player generates over the course of a year, and adjusts for the strength of opponents, instead of the slightly better known DVOA. (After week 8, the opponent adjustments are at 80 percent strength; they will be fully adjusted after week 10.) Broadly, we're using DYAR because we wanted to show how much production each team has gotten from each of its positions, not how well each player has played in whatever snaps he was on the field for. (DVOA is a rate stat, like the NBA's PER, meaning a highly productive five plays would set you ahead of league leaders. We aren't so interested in that here.)
And the usual disclaimer: We're still perfecting how to do these best (and we still aren't doing defense). Email us at [email protected] or [email protected] with suggestions, or hate mail.
A few takeaways at the halfway point:
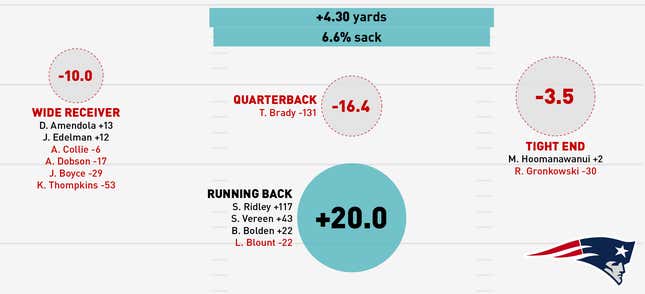
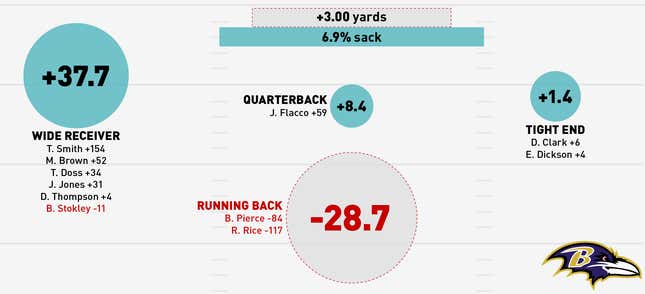
- The disintegration of Ray Rice and Tom Brady this season is astonishing.
- Michael Crabtree's absence has the San Francisco receivers struggling, but it doesn't quite matter because the 49ers are stacked.
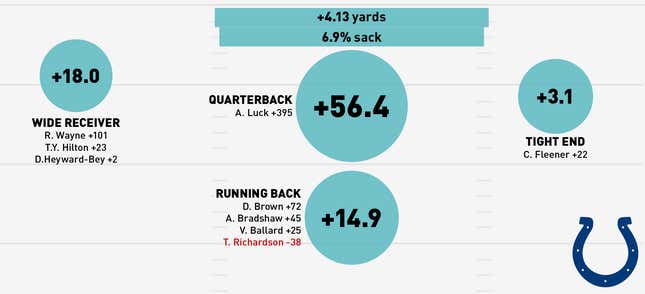
- The Colts continue to have a very good offense without dominating any one position.
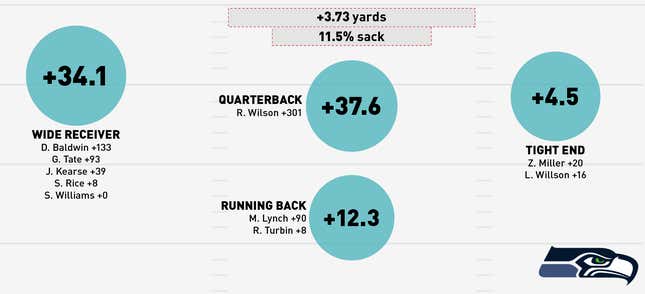
- Seattle's offensive line is negative in rushing and pass protection categories, but the offense as a whole is above average.
- The Jaguars, man.
Average NFL Squads:
Best Possible Squad:
Worst Possible Squad:
Denver Broncos (37.7% Offensive DVOA)

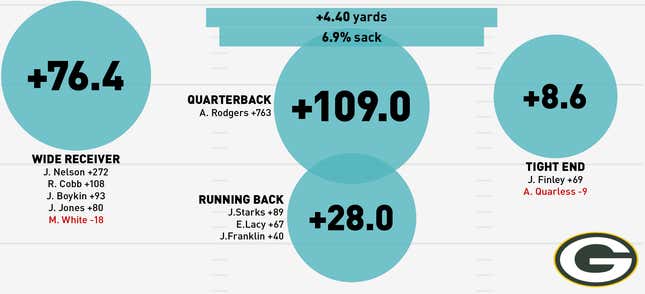
Green Bay Packers (28.6% DVOA)
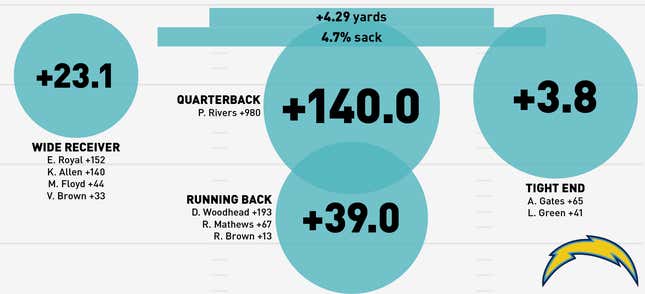
San Diego Chargers (25.0% DVOA)
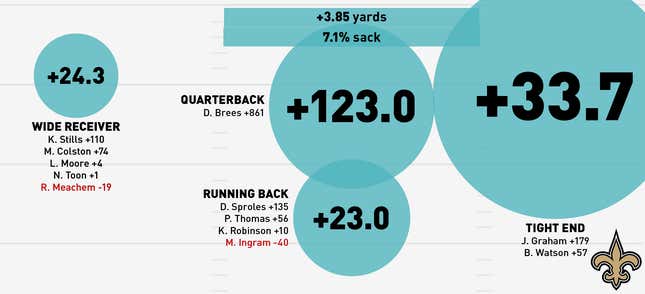
New Orleans Saints (17.8% DVOA)
Indianapolis Colts (17.1% DVOA)
San Francisco 49ers (17.1% DVOA)
Chicago Bears: (17.0% DVOA)
Detroit Lions (13.3% DVOA)

Carolina Panthers (12.8% DVOA)
Atlanta Falcons (8.6% DVOA)
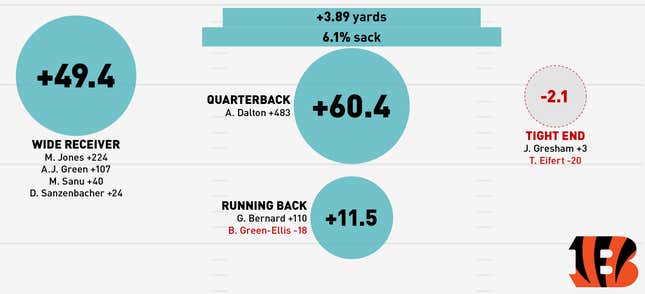
Cincinnati Bengals (7.5% DVOA)
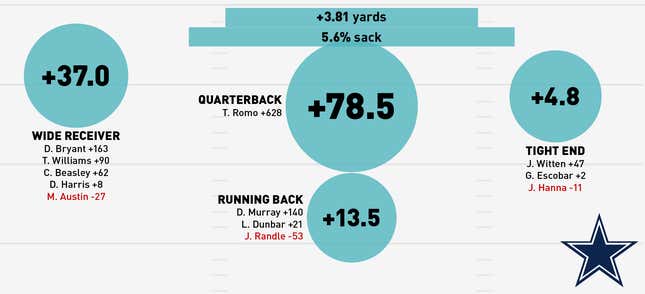
Dallas Cowboys (6.7% DVOA)
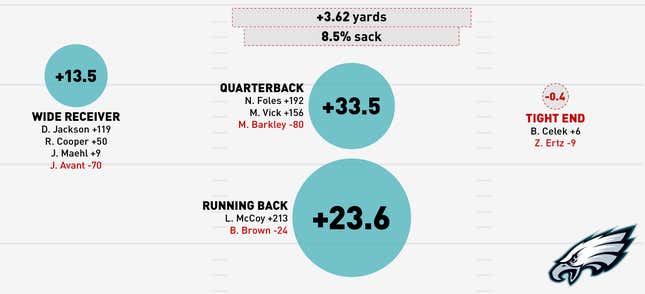
Philadelphia Eagles (6.3% DVOA)
Seattle Seahawks (4.4% DVOA)
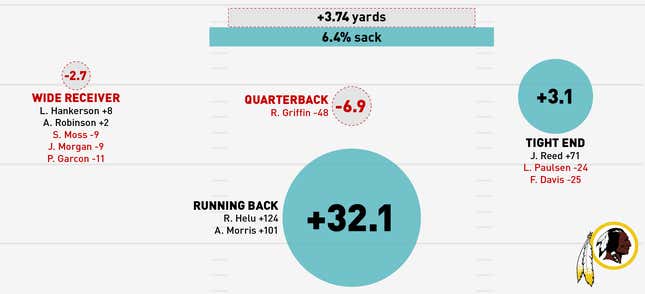
Washington Redskins (-0.4% DVOA)
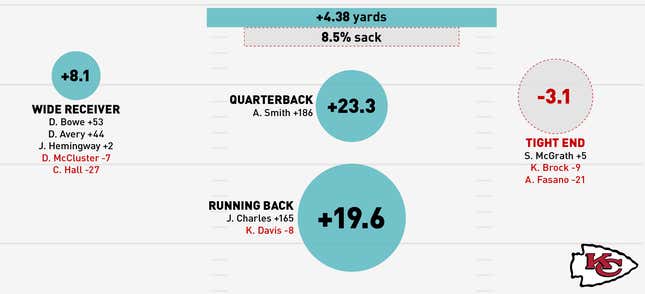
Kansas City Chiefs (-1.6% DVOA)
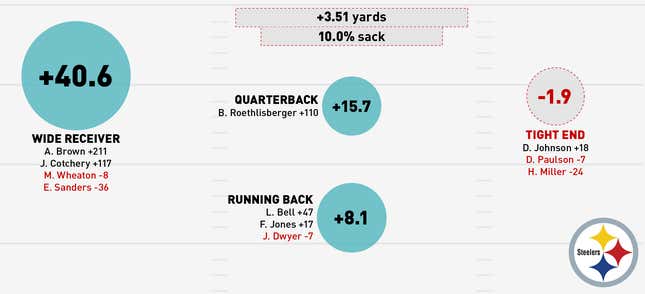
Pittsburgh Steelers (-2.7% DVOA)
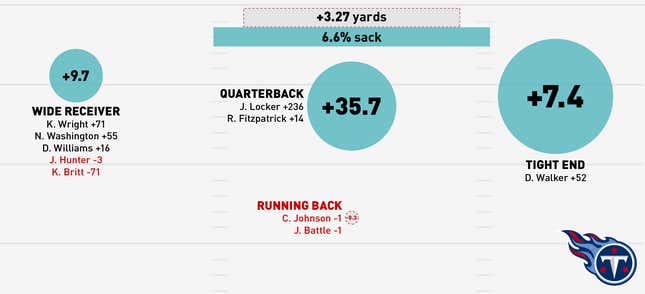
Tennessee Titans (-3.1% DVOA)
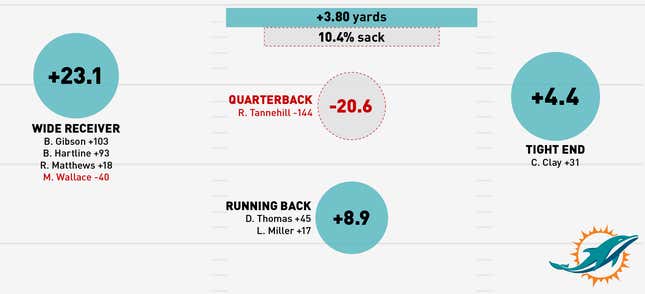
Miami Dolphins (-6.0% DVOA)
New England Patriots (-6.4% DVOA)
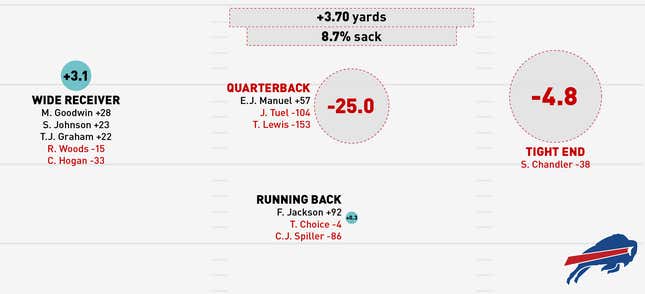
Buffalo Bills (-9.3% DVOA)
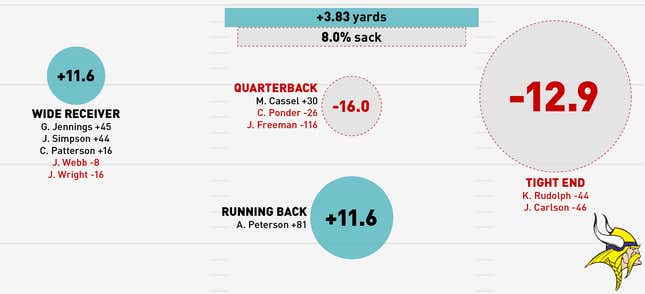
Minnesota Vikings (-10.4% DVOA)
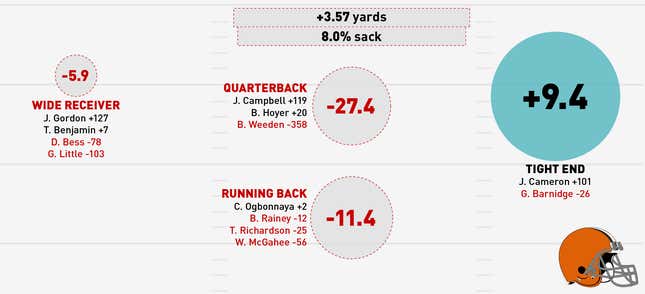
Cleveland Browns (-11.4% DVOA)
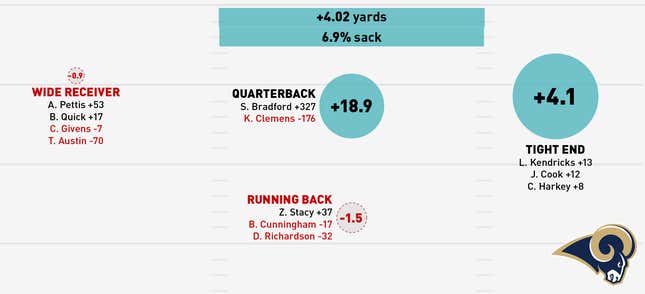
St. Louis Rams: (-13.6% DVOA)
Baltimore Ravens (-14.5% DVOA)
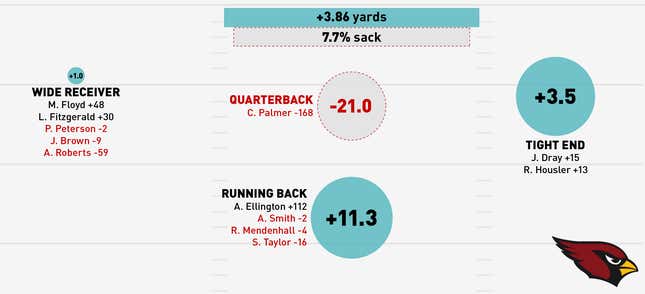
Arizona Cardinals (-14.6% DVOA)
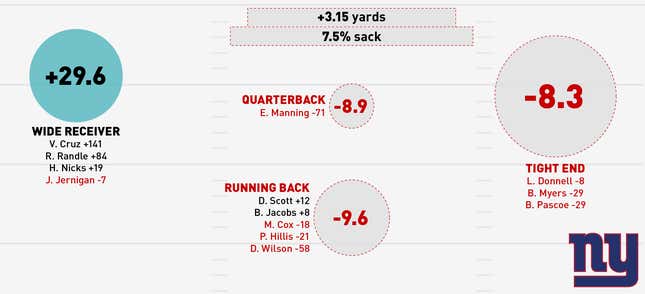
New York Giants (-16.5% DVOA)
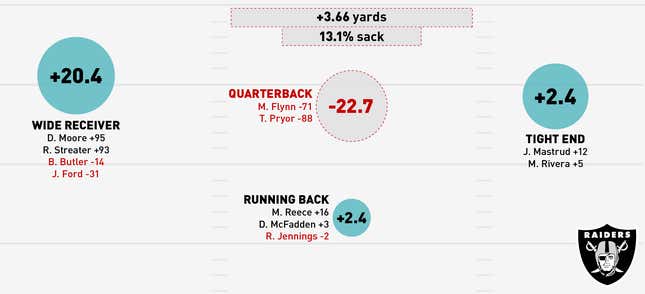
Oakland Raiders (-16.8% DVOA)
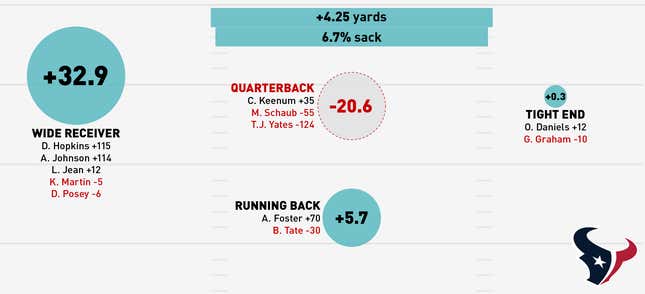
Houston Texans (-17.1% DVOA)
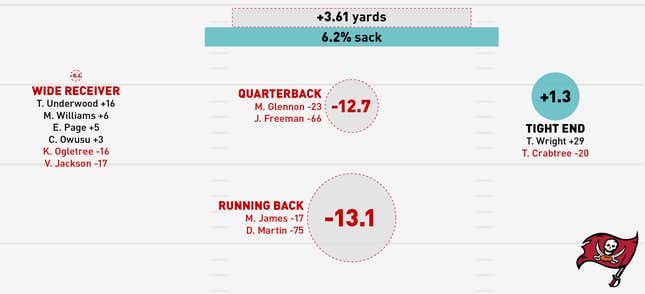
Tampa Bay Buccaneers (-18.0% DVOA)
New York Jets (-22.1% DVOA)
Jacksonville Jaguars (-40.5% DVOA)
Top image by Jim Cooke