There’s a way to look at Steph Curry’s stat line as an artifact of not just box score accounting, but his style. If you look closely, there are traces of the visceral experience of watching Steph double axel around a screen and fire up a three from the hip in arcane statistical whimsy, like fast break points outside the paint or rate of unassisted three-point attempts. LeBron’s line has never really worked like that; his fills up a box score, but we’ll need to do a far better job of harnessing the observational powers of new-wave tech like SportVu to appreciate his typical stats in quite the same way we do Steph’s. But that’s for LeBron’s typical, steady-handed game. In these Finals, he’s become another player entirely.
One dim view of LeBron pummeling the Warriors by shooting 40 percent and stopping the ball for fortnights at a time has been that the stat nerds can suck it, that the illusion of efficiency and mathematical thinking as successful basketball strategy is being dismantled, one burly isolation at a time. This is insane on its face, obviously, but more so because LeBron’s retrograde offense is actually hugely statistically impressive, and proves out a variety of stat nerd precepts.
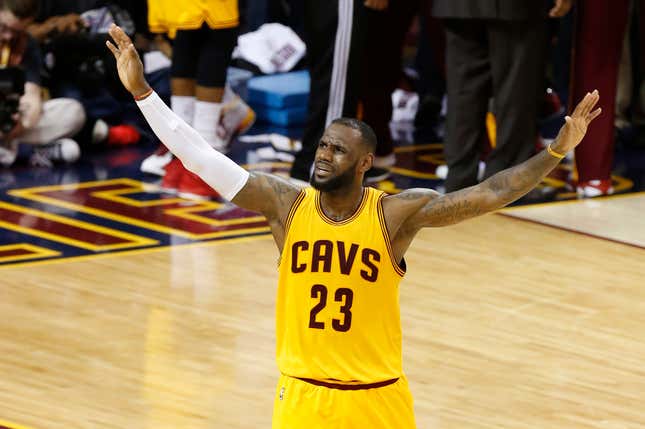
LeBron has averaged 36.5 points, 13.8 rebounds, and 10.8 assists in four games in the Conference Finals and Finals without Kyrie Irving or Kevin Love. In the Finals, he’s averaging 47.4 (!) minutes and on a 44 percent (!!!) Usage Rate. He’s scored the most points ever through the first three games of a Finals. He’s also shot 40 percent from the field and is under 50 True Shooting Percentage for the series, which superficially looks very bad. But the first-level “advanced” stats belie the underlying ridiculousness of doing what LeBron is doing.
The virtues of a workhorse
Let’s start with the usage rate and true shooting, since those are what so much of the noise about LeBron’s plummeting efficiency has basically been referencing. Using 44 percent of your team’s possessions is outrageous, and a sub-50 TS% is generally bad. The basic argument for LeBron holding the rock for the length of a Russian war novel has been laid out: It minimizes turnovers (given the combination of mediocre Cleveland ball handlers and strong, aggressive perimeter defenders for the Warriors), which stops the Dubs’ fast break, and keeps the Cavs’ defenders fresh on the other end.
Still, 44 percent! And 49.4 TS! This looks like the sort of relationship that signals bad, inefficient basketball, and those two stats actually have a pretty consistent relationship. We covered LeBron’s historically awesome performance in this area last year. In the chart below, you can see that the upward limits of volume and efficiency tend to abide by a basic give-and-take, and everyone approaching the furthest reaches at any point along that line is generally a Hall of Fame-type player having an MVP-type season. This is how it looked during the MVP race in 2014:
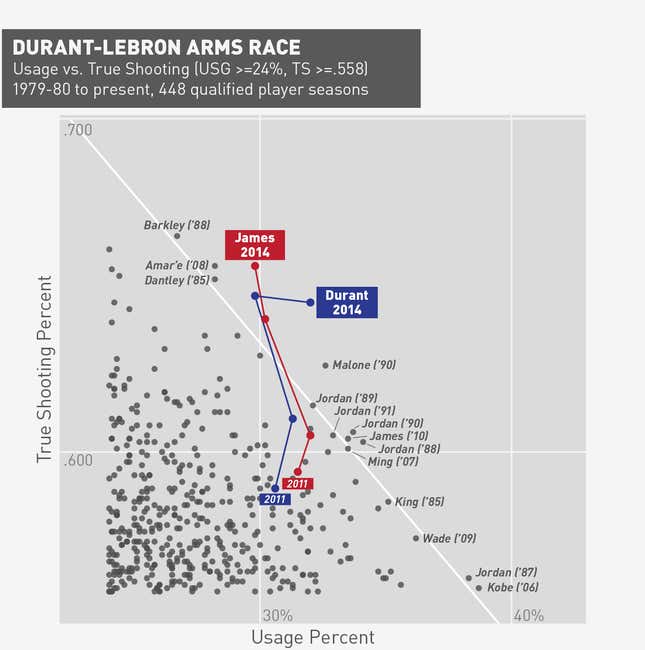
Now, let’s insert Lebron’s Finals stats into the chart. That’s him way down at the bottom right of the chart:
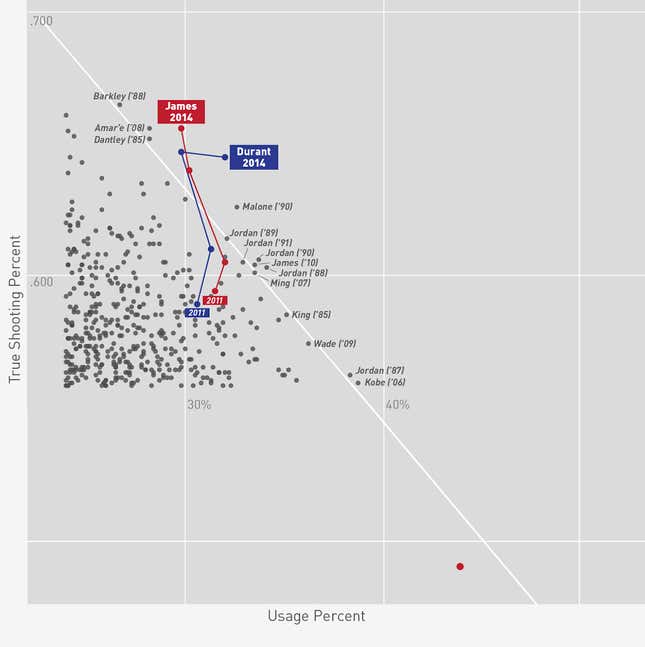
Still right there! It’s especially impressive because LeBron spent the season sitting further back from that elite albeit arbitrary line, with 57.7 TS% and 32.3 USG. The difficulty of muscling even this meek amount of efficiency out of that much usage underwrites an old battleground of advanced NBA stats—namely, having a minutes-soaking player who can produce even when force-fed possessions is inherently valuable. The reliable ability to create a shot, any shot, is inherently valuable.
Larry Brown touches on this in Tom Haberstroh’s post on ESPN about all the attention James has drawn: “When I had Allen [Iverson], my best way to win was for him to shoot 40 times a game,” Brown said. “A lot of people might say some of Allen’s shots weren’t great shots. Well, the ability for him to shoot the ball so many times was, I think, underrated.”
Whether it’s a dreadnought like LeBron or a welterweight like Kobe or a post-up body like Duncan, having a guy who can hold the ball the whole possession and then go create a (shitty) shot actually is a virtue when the realistic alternative is overmatched role players working the ball around and maybe, possibly getting a (shittier) shot.
This is fundamental to what the Cavs are doing this series, and it’s hard to imagine a player better equipped than LeBron who could absorb this much punishment and keep coming.
Slowing down is hard
But usage isn’t the only thing shading LeBron’s efficiency numbers downward. He’s also dealing with the deliberate, strategically slow pace.
According to John Schuhmann at NBA.com, 31 of the Cavs’ 76 shots in game three came in the last 7 seconds of the shot clock, and that number is 39 percent for the series (the league average is 18 percent). Across the league, we know that late-clock possessions are much, much less valuable than other possessions. And obviously, the more a player is forced to take these shots, the worse his numbers will be. So for a strategy like Cleveland’s that necessitates slowing the pace, minimizing possessions against a more talented opponent, and grinding the Warriors defense into paste, it’s incredibly important.
Here’s how LeBron stacked up during last year’s regular season on shots in the last four seconds of the shot clock (we don’t have access to the same data as NBA.com for the 7-second numbers), according to data from Synergy Sports:
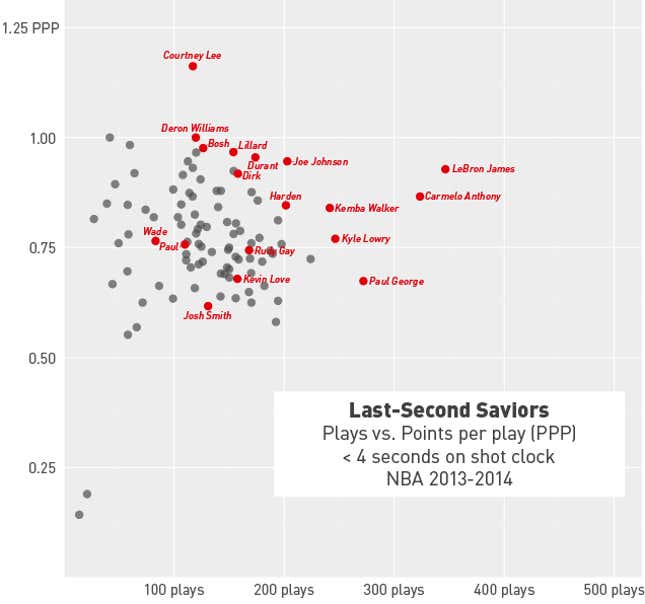
During this year’s regular season, he performed a little worse but in the same general range, with 306 plays at 0.83 points per possession—only James Harden had more possessions on a short clock (big surprise). In the playoffs, though, things have been completely out of hand. Here are this post-season’s numbers, again via Synergy Sports:
| # | Player | Team | GP | % Time | Plays | PPP |
|---|---|---|---|---|---|---|
| 1 | LeBron James | Cleveland Cavaliers | 17 | 24.70% | 146 | 0.699 |
| 2 | James Harden | Houston Rockets | 17 | 16.40% | 74 | 0.851 |
| 3 | Derrick Rose | Chicago Bulls | 12 | 17.20% | 50 | 0.76 |
| 4 | Blake Griffin | Los Angeles Clippers | 14 | 13.50% | 49 | 0.735 |
| 5 | Stephen Curry | Golden State Warriors | 18 | 9.30% | 46 | 1.065 |
| 6 | Jimmy Butler | Chicago Bulls | 12 | 16.50% | 44 | 0.727 |
| 7 | Jamal Crawford | Los Angeles Clippers | 14 | 20% | 43 | 0.488 |
| 8 | Iman Shumpert | Cleveland Cavaliers | 17 | 24.80% | 41 | 0.488 |
| 9 | Al Horford | Atlanta Hawks | 16 | 16.40% | 40 | 0.9 |
| 10 | Marc Gasol | Memphis Grizzlies | 11 | 16.30% | 39 | 0.59 |
| 11 | JR Smith | Cleveland Cavaliers | 15 | 21% | 38 | 1.053 |
| 12 | Terrence Jones | Houston Rockets | 17 | 18.20% | 36 | 0.361 |
| 13 | Jeff Teague | Atlanta Hawks | 16 | 10.70% | 33 | 0.818 |
| 14 | Zach Randolph | Memphis Grizzlies | 11 | 15.90% | 33 | 0.667 |
| 15 | DeMarre Carroll | Atlanta Hawks | 16 | 15.10% | 32 | 0.875 |
| 16 | Harrison Barnes | Golden State Warriors | 18 | 15.40% | 32 | 0.469 |
| 17 | Bradley Beal | Washington Wizards | 10 | 12.30% | 31 | 0.677 |
| 18 | Chris Paul | Los Angeles Clippers | 12 | 13% | 31 | 1 |
| 19 | Dennis Schroder | Atlanta Hawks | 16 | 16.80% | 31 | 0.516 |
| 20 | Klay Thompson | Golden State Warriors | 18 | 8.30% | 30 | 1.1 |
| 21 | Kyrie Irving | Cleveland Cavaliers | 13 | 12.80% | 30 | 1.033 |
| 22 | Matthew Dellavedova | Cleveland Cavaliers | 16 | 20% | 30 | 0.667 |
| 23 | Timofey Mozgov | Cleveland Cavaliers | 17 | 15.90% | 29 | 0.966 |
| 24 | John Wall | Washington Wizards | 7 | 18.40% | 28 | 0.464 |
| 25 | Draymond Green | Golden State Warriors | 18 | 9.10% | 26 | 0.577 |
That’s ridiculous! Basically a quarter of LeBron’s possessions fire with less than four seconds on the shot clock! 0.699 points per possession isn’t great—it’s quite bad, under normal circumstances—but given the circumstances and workload, this remains a crazy-impressive standard.
The rotation is ragged
And finally, there’s the matter of LeBron doing all this out of necessity on offense—but with a purpose in mind. Here are the Cavs’ lineups that played more than 20 minutes together after All Star Break, sorted by defensive rating on NBA.com:
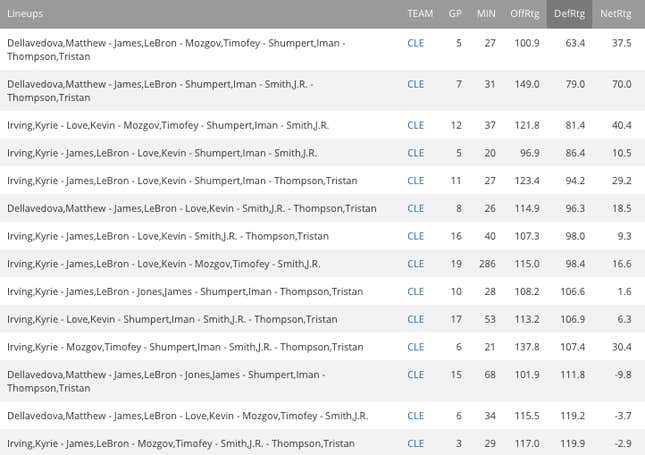
The two best defensive lineups should look familiar to anyone watching these Finals. Those are incredible numbers. For reference, the Warriors had the best defense in the league this year, and for the year they put up a defensive rating of 91.2; the Cavs full-season number was 104.1. A lineup that’s consistently in the 70s or 80s is a top, top tier unit. But look at the minutes—that was a pretty small sample size, so it would make sense if they came back to earth in the playoffs against better competition. Here’s the same list, for the playoffs:
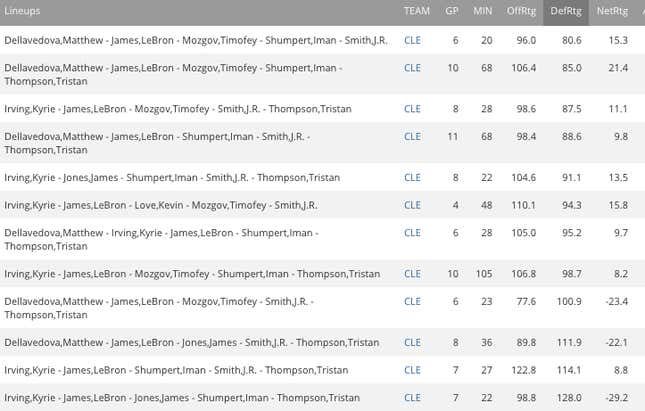
They kept it up! The units featuring the Cavs’ best defenders, forced into extended action because of perhaps fortuitous injuries, are powering the Cavs through the most dangerous offense in the league.
This doesn’t mean the Warriors are frauds
The Warriors are a no-shit all-time great team. If LeBron ends up yanking this series out of his ass, this will likely be a fact lost to time, but by every measurement available to us, they ran off one of the greatest seasons in NBA history, and great regular seasons at this level are not flukes.
But what that voices over is the fact that the numbers demonstrating the Warriors’ unequivocal dominance are abstractions of play—they’re subject to thousands of complex dynamics that escape current observation, and which only reflect part-way in the final box scores. Golden State looking like hell against this ragged-ass Cavs team is a good reminder that Net Ratings aren’t just video game power levels, the greater longview efficiency crushing the lesser. They’re subject to complications, like the greatest player of his generation just saying he’s done and beating the living shit out of everything around him.
Photo via AP / Charts by Reuben Fischer-Baum & Sam Woolley