Note: An earlier version of this post was missing two key elimination games – 1988 Game 7 and 1993 Game 6 – which are now included in the rankings.
From the comeback, to Ray Allen's shot, to overtime, Game 6 of the 2013 NBA Finals had about as amazing an ending as you'll ever find. Game 7 didn't have quite the same dramatics, but it was tight throughout, and it was a fucking Game 7. So how did it stack up against the best NBA elimination games of all time?
To find out, we made a new Watchability Rating™ for all 46 NBA finals elimination games, going back to 1982 (before 1982, finals box scores were missing fouls and field goals attempted, two key stats for our system). These ratings are designed to be mostly context-free, ignoring narratives like Jordan's impending retirement or LeBron's quest for his first ring. Also, these are ratings of a game's "watchability," not its quality. Early in the 2013 playoffs, Paul George netted a triple-double for the Pacers, with 17 of his 23 points coming from the free-throw line. It was great basketball by George, and not very watchable.
Here's our system (you can check out the exact equations at the bottom of the post):
- Closeness (out of 25): Huge comebacks aside, the best playoff games are the ones that are close. This rating comes from the average of the point differential after each quarter, weighted towards the later quarters. OT games get a slight additional bonus.
- Game in series (out of 20): Obviously Game 7s are more watchable than Game 6s, which are more watchable than Game 5s, etc.
- Points-per-attempt (out of 20): Stifling defenses are impressive, but we prefer games with efficient offensive play. The higher the combined points-per-attempt for each team, the higher the score.
- Showdown (out of 15): While offensive efficiency is cool, it's also cool when the top players decide to take the game into their own hands. This score comes from the combined point totals of the lead scorers on each team.
- Comebacks (out of 10): Comebacks are great! This score comes from the number of points that the team losing at the end of the third quarter makes up. Successful comebacks are worth double.
- Fouls (out of 10): Fouls are death for game flow. The fewer fouls, the higher the score.
Here are the ten most watchable NBA finals elimination games since 1982:
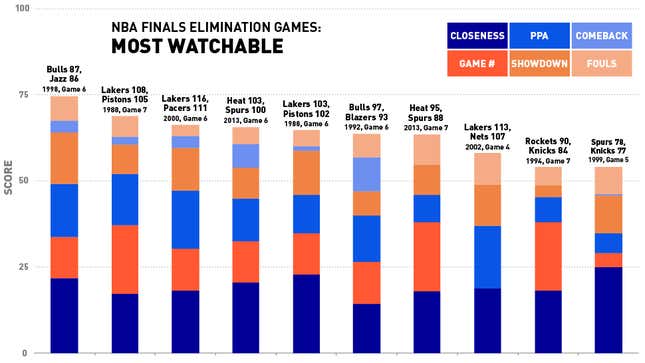
The top five:
- 1998 Finals, Game 6 (Bulls 87, Jazz 86): The game was close throughout. The Bulls went into the fourth quarter behind. Jordan and Malone combine for 76 points. It ended like this. This takes the top spot, and it isn't even particularly close.
- 1988 Finals, Game 7 (Lakers 108, Pistons 105): A furious rally by the Pistons in the first Game 7 of the 2-3-2 era falls short, as Detroit cut a 15-point fourth quarter deficit to two with 1:17 remaining. The Lakers hold on thanks to James Worthy's 36-16-10, the first triple double of his career.
- 2000 Finals, Game 6 (Lakers 116, Pacers 111): Despite Reggie Miller's struggles from behind the arc, this was a high-scoring, hyper-efficient game (1.08 PPA). The Pacers led most of the way, but eight bench points from Robert Horry and some huge plays by a 21-year old Kobe ushered in the beginning of the Bryant/Shaq era.
- 2013 Finals, Game 6 (Heat 103, Spurs 100): This one just happened.
- 1988 Finals, Game 6 (Lakers 103, Pistons 102): Isaiah Thomas put up 43 points and eight assists on a sprained ankle, but it wasn't enough to stop the Lakers from forcing a game seven. 25 of those points were in the third quarter – erasing a seven point halftime deficit.
Here are the ten least watchable games, going back to 1982:
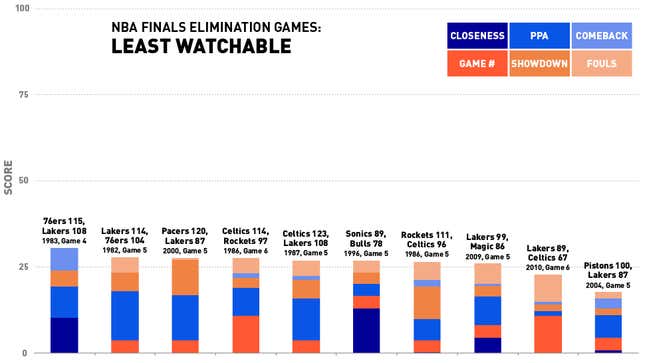
Game 5 of the 2004 Finals, the end of the Shaq/Kobe era, was some crappy basketball. The Pistons had a 23-point lead going into the fourth; they ended up winning by 13. There were 54 fouls. If you ignore that it was a Game 6, the 2010 "showdown" between Celtics and the Lakers was actually a lot worse. The Lakers held a 25-point lead going into the fourth, which was pretty unassailable given that the Celtics had only scored 51 up to that point. They added just 16 in the final quarter, as the teams combined for a terrible points per attempt of 0.79.
Here are all 46 games, ranked:
| Rank | Game | Closeness (25) | Game # (20) | PPA (20) | Showdown (15) | Comeback (10) | Fouls (10) | Total Score (100) |
|---|---|---|---|---|---|---|---|---|
| 1 | 1998, Game 6 | 22 | 12 | 15 | 15 | 3 | 7 | 74.6 |
| 2 | 1988, Game 7 | 17 | 20 | 15 | 9 | 2 | 6 | 69.1 |
| 3 | 2000, Game 6 | 18 | 12 | 17 | 13 | 3 | 3 | 66.3 |
| 4 | 2013, Game 6 | 20 | 12 | 12 | 9 | 7 | 5 | 65.6 |
| 5 | 1988, Game 6 | 23 | 12 | 11 | 13 | 1 | 5 | 64.7 |
| 6 | 1992, Game 6 | 14 | 12 | 13 | 7 | 10 | 7 | 63.6 |
| 7 | 2013, Game 7 | 18 | 20 | 8 | 9 | 0 | 9 | 63.5 |
| 8 | 2002, Game 4 | 19 | 0 | 18 | 12 | 0 | 9 | 58.1 |
| 9 | 1994, Game 7 | 18 | 20 | 7 | 3 | 0 | 5 | 54.1 |
| 10 | 1999, Game 5 | 25 | 4 | 6 | 11 | 0 | 8 | 54.0 |
| 11 | 1993, Game 6 | 19 | 12 | 9 | 6 | 2 | 5 | 53.4 |
| 12 | 1994, Game 6 | 20 | 12 | 8 | 7 | 0 | 6 | 53.1 |
| 13 | 2011, Game 6 | 11 | 12 | 18 | 3 | 0 | 9 | 53.1 |
| 14 | 2005, Game 7 | 19 | 20 | 7 | 0 | 0 | 6 | 51.4 |
| 15 | 2006, Game 6 | 22 | 12 | 4 | 10 | 0 | 3 | 51.3 |
| 16 | 1998, Game 5 | 21 | 4 | 9 | 11 | 1 | 4 | 49.8 |
| 17 | 1997, Game 6 | 18 | 12 | 4 | 8 | 4 | 3 | 49.2 |
| 18 | 1984, Game 6 | 13 | 12 | 11 | 8 | 3 | 3 | 49.2 |
| 19 | 1993, Game 5 | 11 | 4 | 15 | 11 | 0 | 9 | 49.2 |
| 20 | 2010, Game 7 | 20 | 20 | 0 | 0 | 3 | 6 | 49.0 |
| 21 | 2005, Game 6 | 15 | 12 | 12 | 2 | 0 | 8 | 48.8 |
| 22 | 1995, Game 4 | 13 | 0 | 20 | 8 | 0 | 6 | 47.6 |
| 23 | 1991, Game 5 | 19 | 4 | 17 | 6 | 0 | 2 | 46.8 |
| 24 | 1984, Game 7 | 10 | 20 | 6 | 5 | 1 | 2 | 44.5 |
| 25 | 1982, Game 6 | 11 | 12 | 12 | 7 | 0 | 3 | 44.4 |
| 26 | 1990, Game 5 | 20 | 4 | 9 | 4 | 3 | 2 | 42.0 |
| 27 | 2008, Game 5 | 14 | 4 | 12 | 10 | 1 | 1 | 42.0 |
| 28 | 2003, Game 6 | 13 | 12 | 3 | 1 | 4 | 8 | 41.7 |
| 29 | 1996, Game 6 | 8 | 12 | 7 | 2 | 0 | 10 | 39.5 |
| 30 | 1989, Game 4 | 17 | 0 | 10 | 10 | 1 | 1 | 39.4 |
| 31 | 2007, Game 4 | 20 | 0 | 5 | 5 | 2 | 7 | 38.8 |
| 32 | 1987, Game 6 | 7 | 12 | 6 | 10 | 0 | 3 | 38.6 |
| 33 | 1985, Game 6 | 11 | 12 | 4 | 9 | 0 | 3 | 38.2 |
| 34 | 2008, Game 6 | 0 | 12 | 17 | 3 | 0 | 4 | 36.1 |
| 35 | 2012, Game 5 | 0 | 4 | 17 | 8 | 3 | 4 | 35.2 |
| 36 | 2001, Game 5 | 7 | 4 | 10 | 11 | 1 | 2 | 34.9 |
| 37 | 1983, Game 4 | 11 | 0 | 10 | 5 | 7 | 0 | 33.8 |
| 38 | 1982, Game 5 | 0 | 4 | 16 | 6 | 0 | 5 | 30.8 |
| 39 | 2000, Game 5 | 0 | 4 | 15 | 11 | 0 | 1 | 30.6 |
| 40 | 1986, Game 6 | 0 | 12 | 9 | 3 | 1 | 5 | 30.5 |
| 41 | 1987, Game 5 | 0 | 4 | 14 | 6 | 1 | 5 | 29.7 |
| 42 | 1996, Game 5 | 14 | 4 | 4 | 4 | 0 | 4 | 29.7 |
| 43 | 1986, Game 5 | 0 | 4 | 7 | 10 | 2 | 6 | 29.2 |
| 44 | 2009, Game 5 | 5 | 4 | 9 | 3 | 1 | 7 | 28.9 |
| 45 | 2010, Game 6 | 0 | 12 | 1 | 2 | 1 | 9 | 25.2 |
| 46 | 2004, Game 5 | 1 | 4 | 7 | 2 | 3 | 2 | 19.6 |
The exact equations. Closeness: ((Abs(diff Q1)) + ((Abs(diff Q2))*2 + (Abs(diff Q3))*4 + (Abs(diff Q4))*8)/15 = z. If z > 15 then score = 0, if z < 15 then score is normalized to a reversed 25-point scale. For OT games, that first equation is ((Abs(diff Q1)) + ((Abs(diff Q2))*2 + (Abs(diff Q3))*4 + (Abs(diff Q4))*11.33)/18.33. Game in Series: Game 7 = 20, Game 6 = 12, Game 5 = 4, Game 4 = 0. Points-per-attempt: Points-per-attempt determined by (Points - Free Throw Made)/FGA = z, normalized to 20-point scale by. Showdown: Sum of top two point totals on each team = z, normalized to a 15-point scale. Comebacks: If diff Q3 < 0 (the team losing went on to win), z = -(diff Q3)*2. If diff Q3 > 0 AND diff Q4 < diff Q3, z = (diff Q3) - (diff Q4). If diff Q3 > 0 AND diff Q4 > diff Q3, z = 0. Normalized to a 10-point scale. Fouls: # of fouls = z, normalized to a reversed 10-point scale.
Image by Jim Cooke.