The NFL regular season is over. So how did your team do?
How These Work
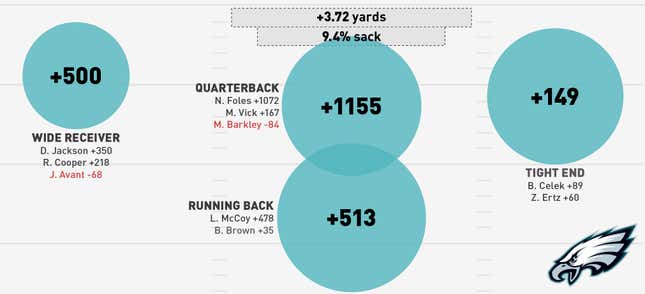
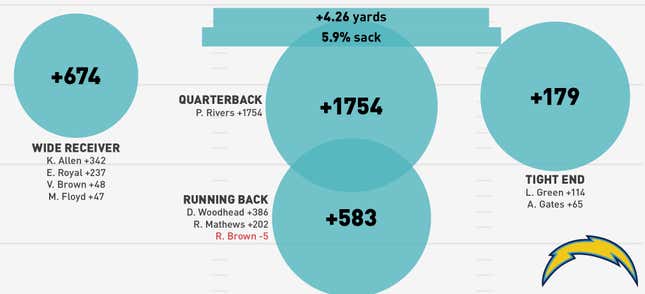
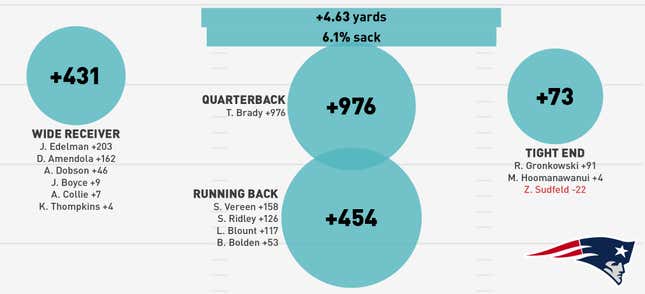
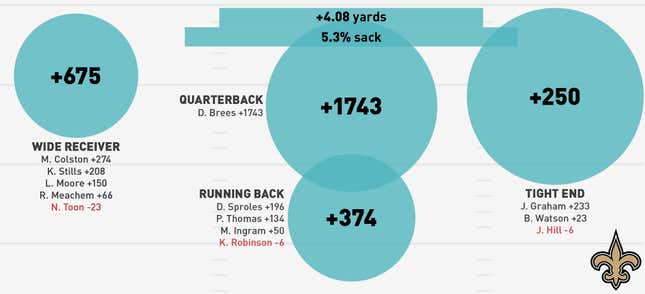
As we have in the past, these charts are based on Football Outsiders' DYAR stat, which compiles everything a player does on the field—yards, catches, third down conversions, touchdowns—and adjusts them against the quality of the defense each week to give you a sense of how much each player has produced, not how well they've played per touch, or per game. So a player who's been shockingly productive in a small amount of carries (Toby Gerhart, say) will look good, but not off the charts good. Offensive line is broken into run blocking and pass protection stats, also provided by FO.
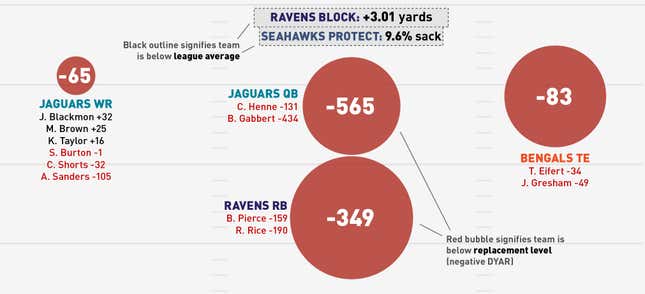
The charts have three colors: BLUE, GREY, and RED. Blue means a team is above league average at that position, and the larger the bubble, the better they are. Grey means a team is below league average at that position, and the smaller the bubble, the worse they are. Red is god awful, and means the position isn't just below average, it's actually below replacement level (similar to the replacement level from WAR in baseball). It means the team could, hypothetically, hire a bunch of free agents off the street and get better production than its paid starters. A larger red bubble is worse than a smaller red bubble, but any red at all is disastrous.
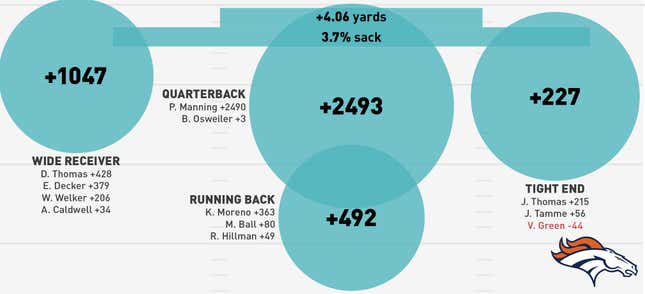
As an illustration, here's each position progressing from the best squad in the NFL (i.e. "Broncos" at QB) to the worst squad in the NFL ("Ravens" at RB):
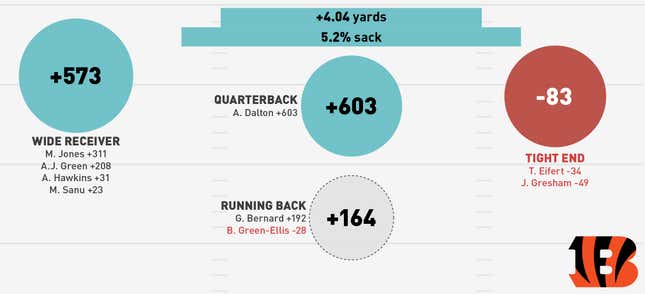
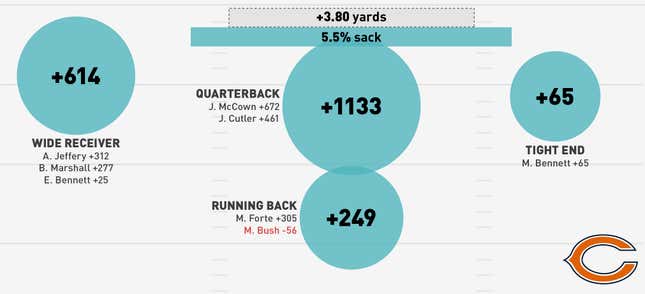
We've split the charts into playoff teams and non-playoff teams, so you can see that Cincinnati, 17th overall, has the worst offense of anyone in the postseason, while the Bears, sixth, have the best offense of the non-playoff teams. We tried to make the charts as easy to understand for non-nerds as possible, but let us know if you've got any questions.
A few year-end takeaways:
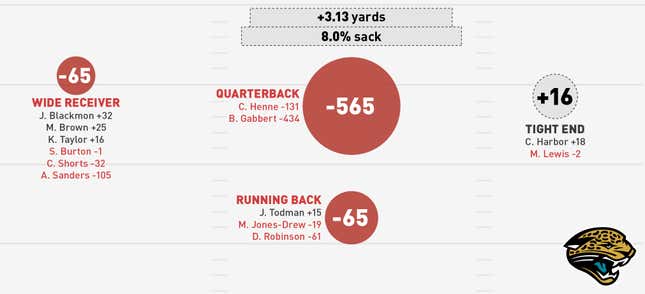
- We say this every single time, but oh my god Blaine Gabbert. Despite playing just three games this season, he led the league in negative DYAR with -434. Brandon Weeden played in eight games and was second with -429. These are remarkable numbers, given that DYAR is a counting stat. Willis McGahee is also third-worst in the league having appeared in just 12 games after the Browns traded away Trent Richardson (Richardson's composite DYAR was ninth-worst among running backs).
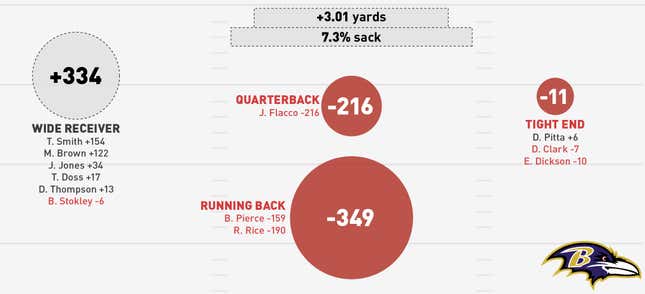
- The two running backs below McGahee are both from the same backfield. Ray Rice and Bernard Pierce have been dreadful all season, and while this does reflect serious dropoffs in their play and the high rate of carries they continue to get, it also reflects a team-wide malady that DYAR can't quite capture. The Ravens offense is broken, as you can see from Baltimore having the worst rushing stats of any offensive line.
DYAR attempts to separate those, but it's very hard to do so(Correction: DYAR doesn't attempt to separate these stats. The Ravens terrible O-line stats and the Ravens terrible running back DYAR are definitely interconnected). So while they've produced the worst results in the league, we're not sure anyone could have done much better. - One position that doesn't see many negative figures for DYAR is wide receiver. This, we think, illustrates a fundamental truth about the position, namely that it's a lot easier to find replacement level wide receivers off the scrapheap than it is to find, say, a quarterback. This is compounded by the fact that wide receivers are more likely to see their involvement in the offense cut if they perform poorly, so it's hard to accumulate large negative DYAR values.
- That makes it all the more astonishing that the Browns have the two worst WRs in the league, Greg Little and Davone Bess (-171 and -134 respectively) while also having the third best in Josh Gordon (+389, in 14 games).
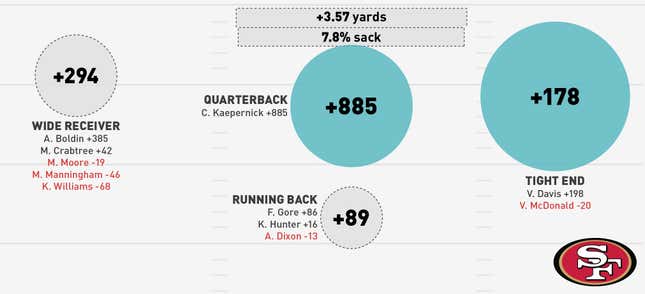
- It's impressive that the 49ers have managed to be the 8th best offense by DVOA, given that they only have two positions playing above league average by DYAR standards. But they're not woefully short at the other positions, and the return of Michael Crabtree has helped.
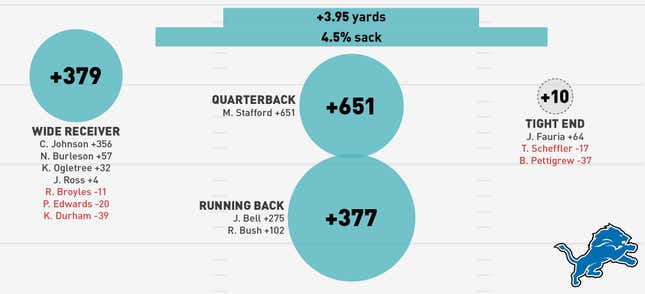
- It's likewise befuddling that the Lions have every position but tight end playing above league average and managed to be 19th in overall offensive DVOA. This at least gives some hope that whoever takes over the team has a chance to turn things around quickly.
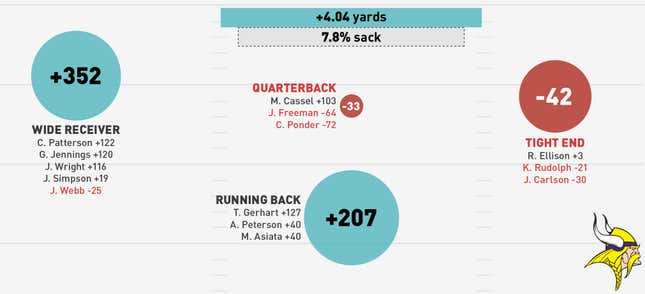
- Adrian Peterson simply wasn't the same player he has been in past years. This isn't even a direct comparison to his superhuman 2012—he was a 43rd of 96 qualifiers among running backs, and even by traditional metrics, 4.5 yards per carry is pretty pedestrian for AD. We don't know how he'll come back after his knee surgery, but an extended rest after two brutal, high-workload seasons will hopefully do him some good.
Average Squad:

Best Squad:
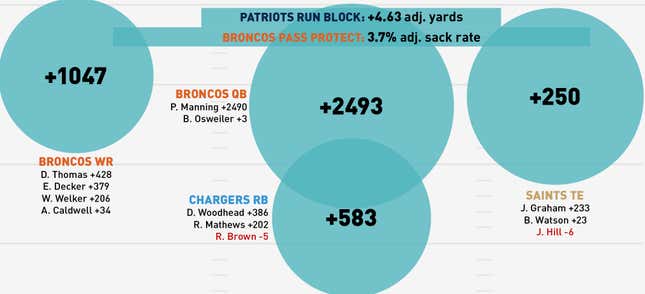
Worst Squad:
Playoff Teams:
1. Broncos (+33.7 Percent Offensive DVOA)
2. Eagles (+22.9 Percent)
3. Chargers (+22.5 Percent)
4. Patriots (+16.4 Percent)
5. Saints (+15.9 Percent)
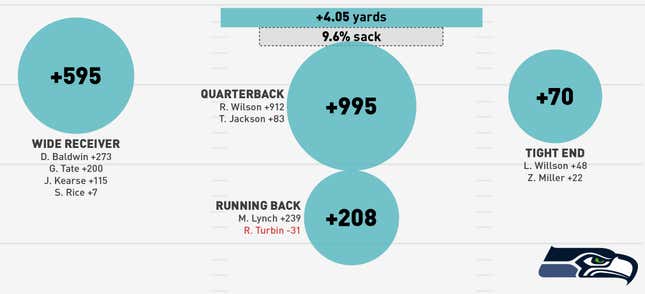
7. Seahawks (+16.4 Percent)
8. 49ers (+9.1 Percent)
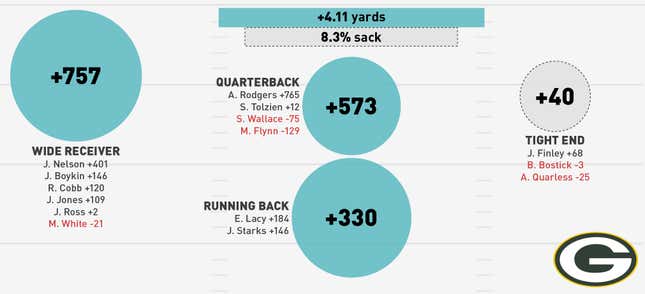
9. Packers (+8.6 Percent)
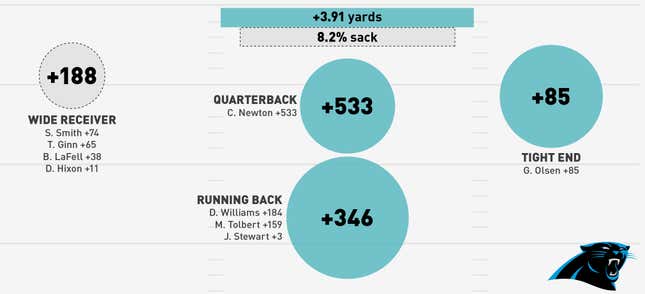
10. Panthers (+8.1 Percent)
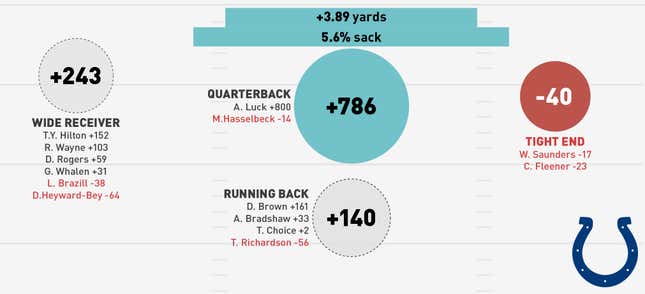
13. Colts (+4.2 Percent)
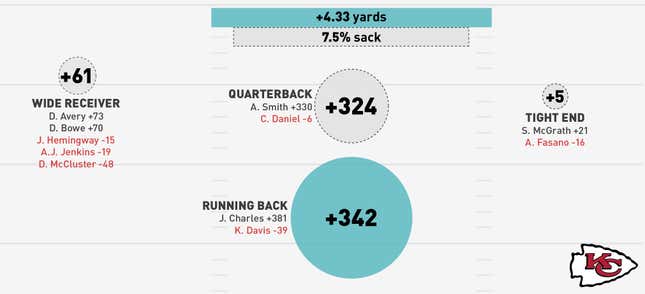
15. Chiefs (+2.8 Percent)
17. Bengals (+0.5 Percent)
Non-Playoff Teams:
6. Bears (+13.8 Percent)
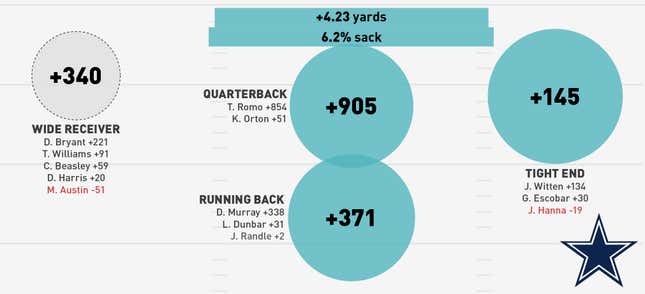
11. Cowboys (+7.5 Percent)
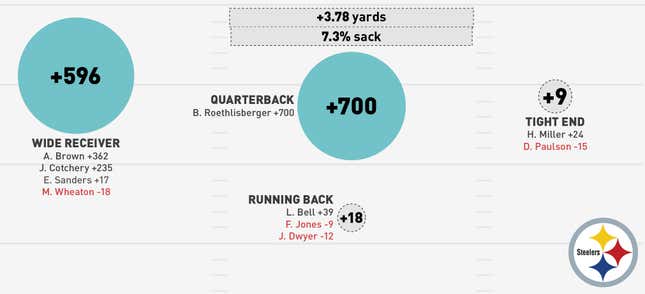
12. Steelers (+4.4 Percent)
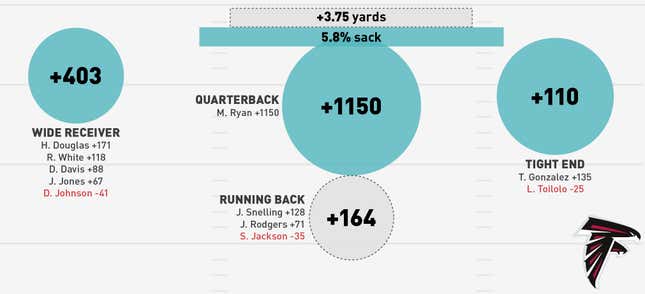
14. Falcons (+3.2 Percent)
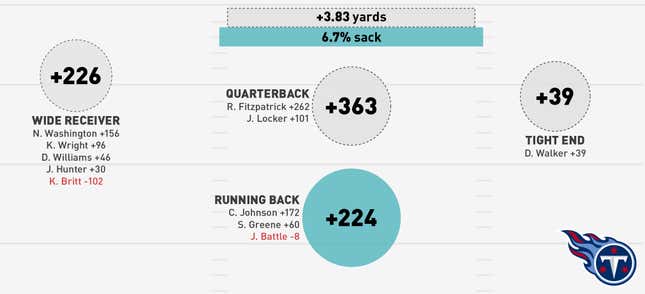
16. Titans (+1.3 Percent)
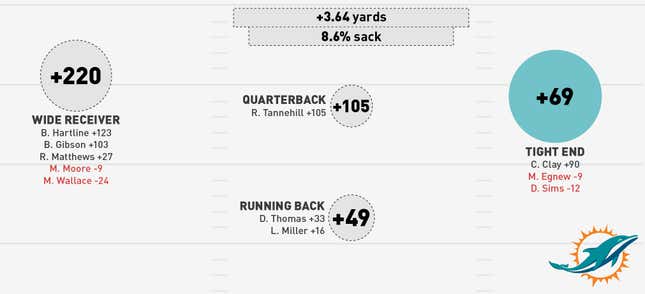
18. Dolphins (-1.8 Percent)
19. Lions (-1.9 Percent)
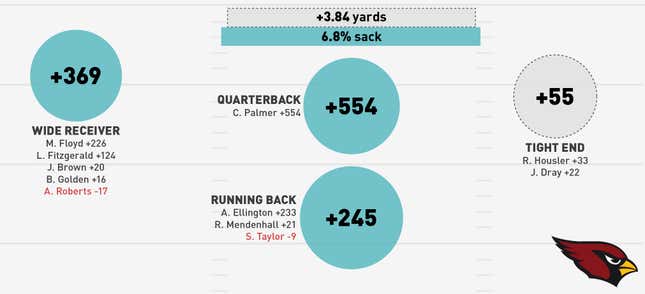
20. Cardinals (-2.6 Percent)
21. Vikings (-4.7 Percent)
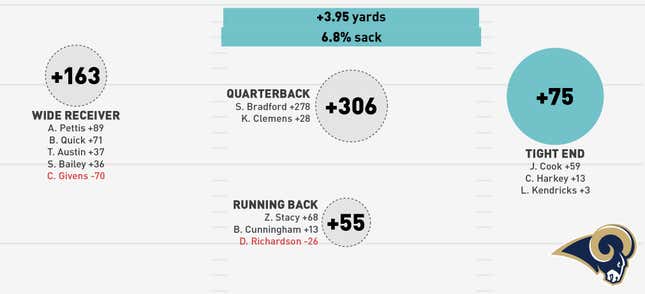
22. Rams (-9.6 Percent)
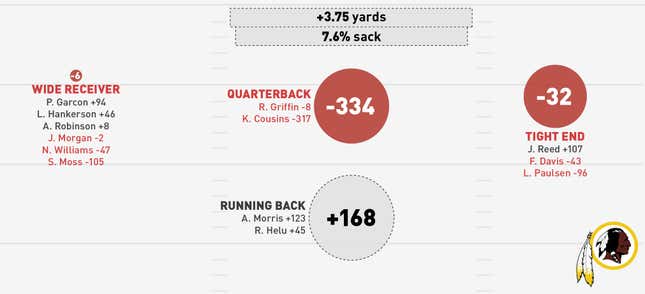
23. 'Skins (-10.0 Percent)
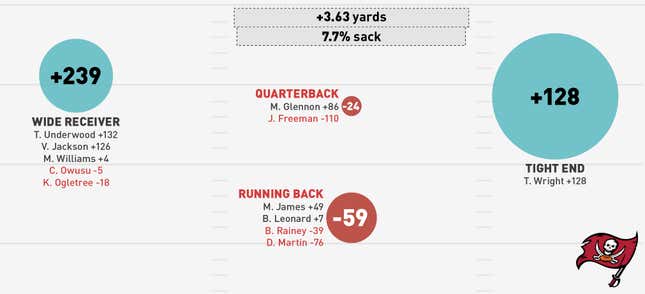
24. Buccaneers (-10.5 Percent)
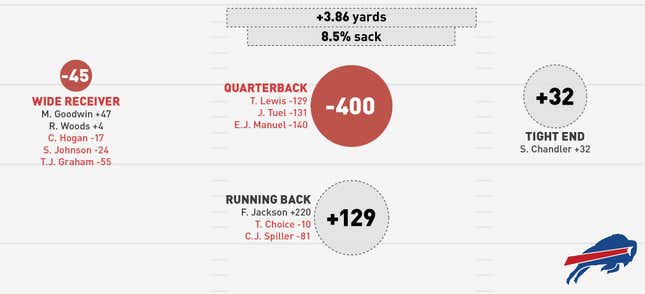
25. Bills (-11.4 Percent)
26. Browns (-14.4 Percent)

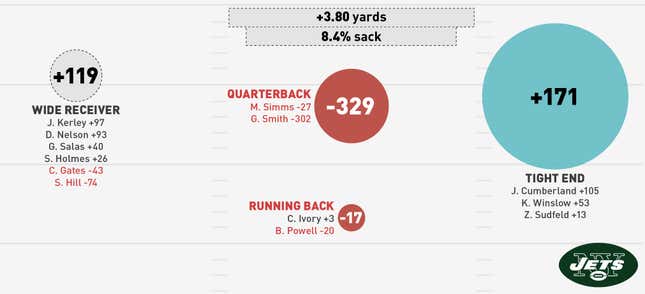
27. Jets (-15.2 Percent)
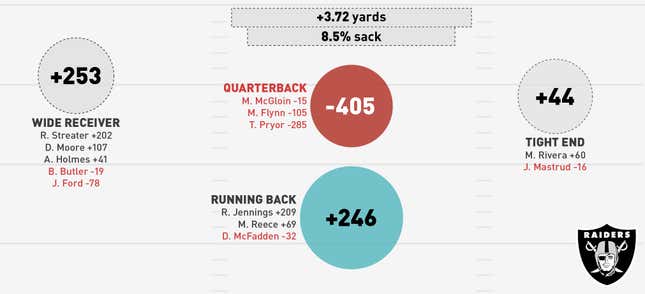
28. Raiders (-16.8 Percent)
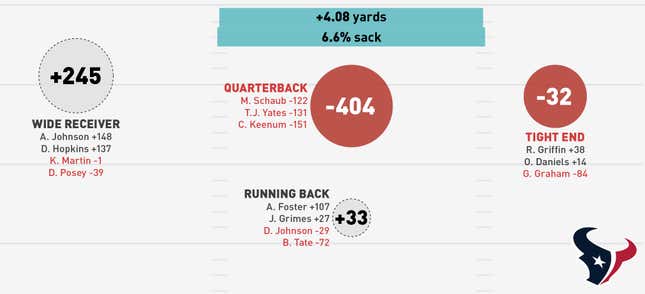
29. Texans (-18.9 Percent)
30. Ravens (-21.3 Percent)
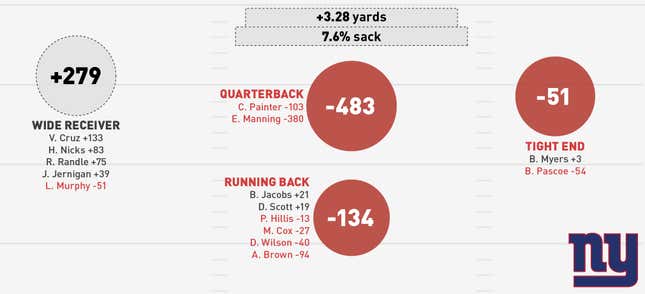
31. Giants (-22.2 Percent)
32. Jaguars (-29.8 Percent)
Top image by Sam Woolley